Smart cities are redefining urban development through large-scale infrastructure, digital platforms, utilities, transportation, energy, and sustainability projects. However, managing multiple smart city projects across cities, departments, contractors, and timelines without a structured system often leads to budget overruns, hidden delays, and weak accountability.
That is exactly where the Smart Cities Project Management Dashboard in Excel becomes a powerful and practical solution. 🚀
This professionally designed Excel dashboard converts complex project data into clear KPIs, interactive charts, and actionable insights. As a result, city authorities, planners, PMOs, and government teams gain full visibility into project progress, costs, delays, and performance—without relying on expensive project management or BI tools.
Built entirely in Microsoft Excel, this dashboard delivers clarity, control, and confidence for managing smart city initiatives efficiently.
Key Features of Smart Cities Project Management Dashboard in Excel 🔑
📊 Centralized Project Tracking
Monitor all smart city projects from one structured Excel dashboard.
📈 Planned vs Actual Cost Monitoring
Track cost variance instantly to prevent budget overruns.
⏱️ Delay & Progress Visibility
Identify delayed and in-progress projects before risks escalate.
🏙️ City-Wise & Department-Wise Insights
Compare project performance across cities and departments easily.
🧭 Interactive Slicers & Page Navigator
Filter by city, department, project type, manager, or month in seconds.
📅 Monthly Trend Analysis
Understand how project costs and delays change over time.
⚡ Faster Decision-Making
Visual KPIs replace manual status reporting and guesswork.
What’s Inside the Smart Cities Project Management Dashboard in Excel 📁
This ready-to-use Excel solution includes five analytical dashboard pages, along with a Data Sheet and Support Sheet, all designed for clarity and ease of use.
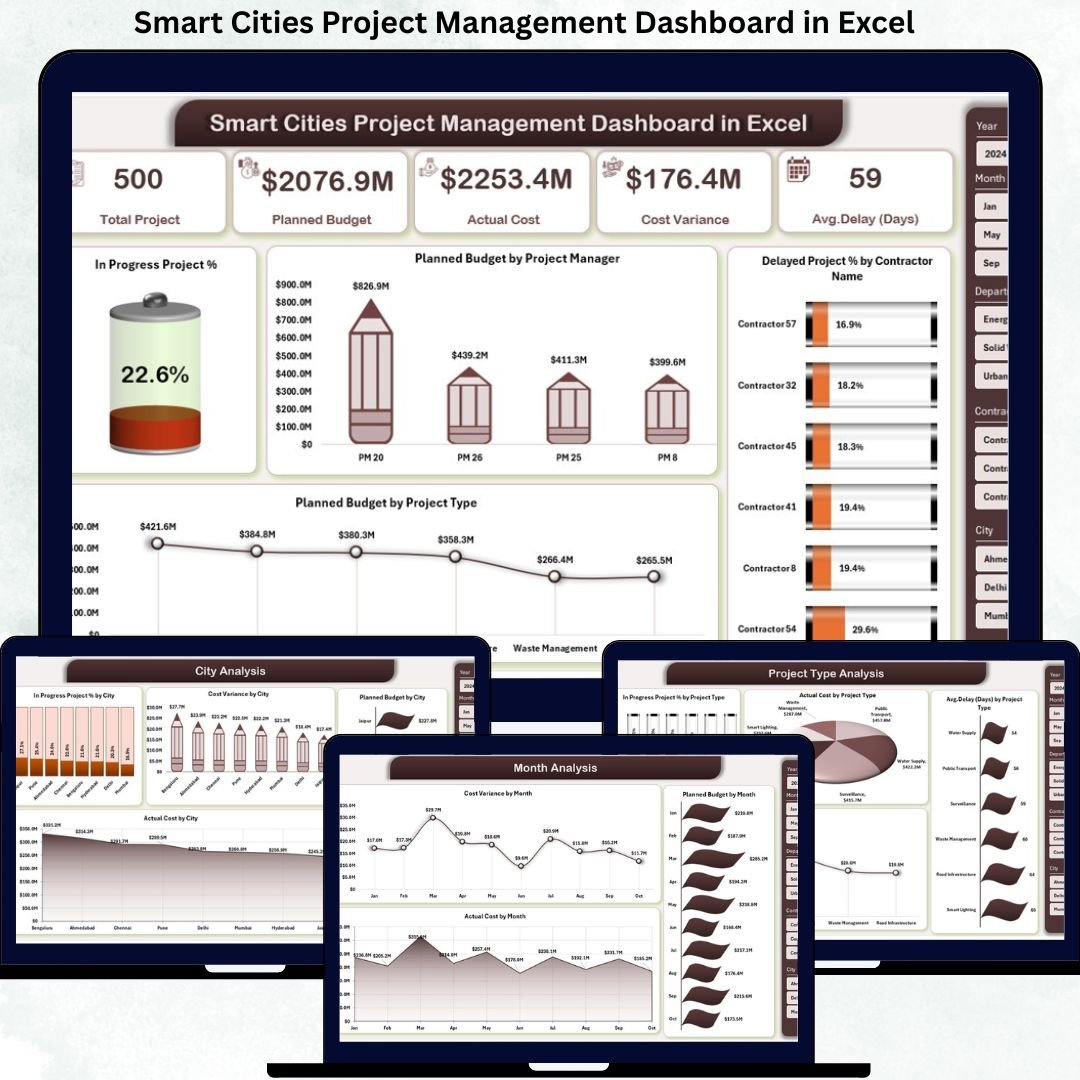
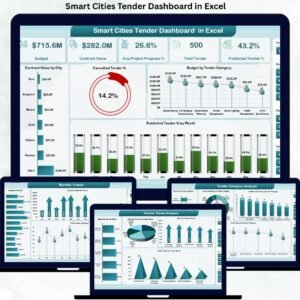
📄 Overview Page
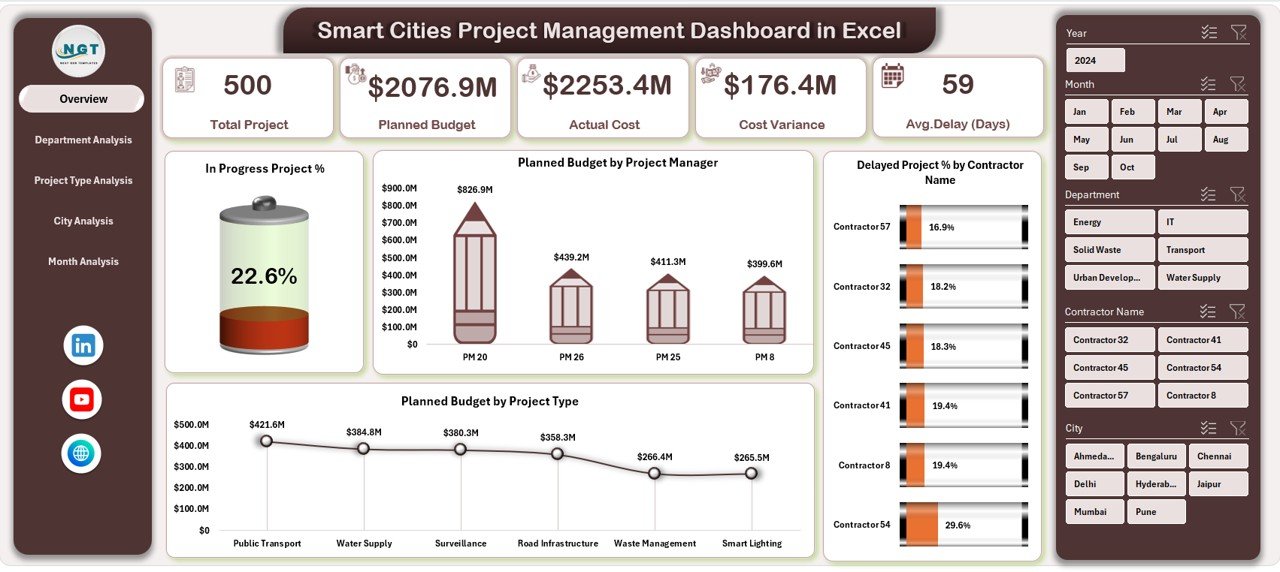
The command center of the dashboard that delivers a quick snapshot of overall project health.
Includes:
-
KPI Cards: In Progress Project %, Planned Budget, Delayed Project %, Total Projects
-
In Progress Project % by Dimension
-
Planned Budget by Project Manager
-
Delayed Project % by Contractor
-
Planned Budget by Project Type
This page helps leadership instantly spot risks, workload distribution, and budget concentration.
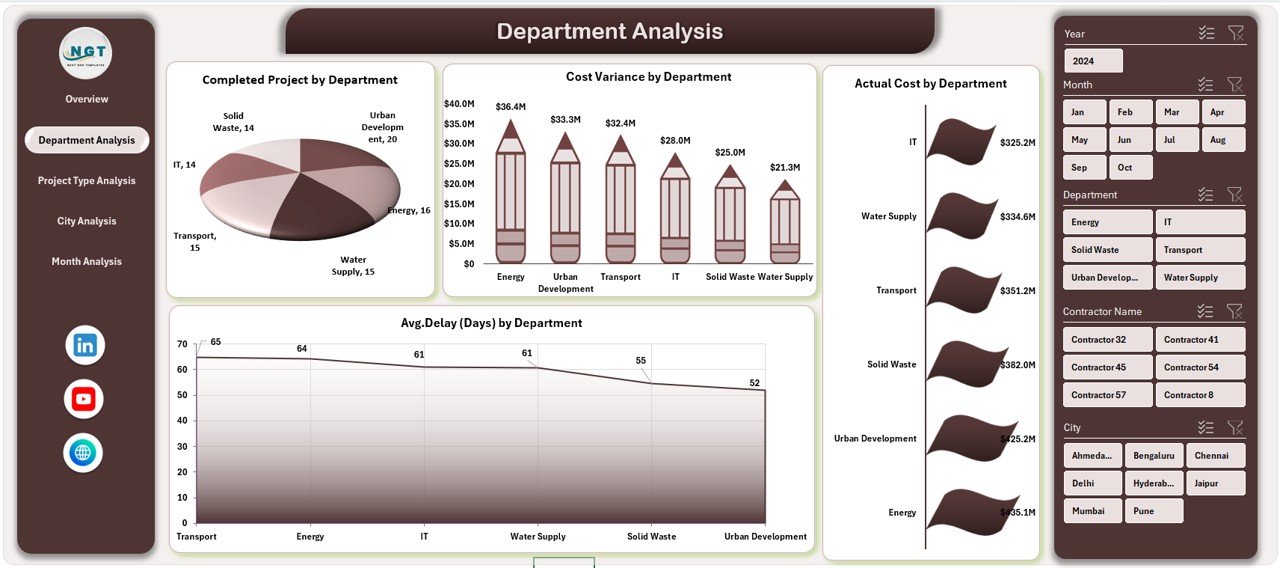
📄 Department Analysis Page
Focuses on department-level project performance and accountability.
Includes:
-
Completed Projects by Department
-
Cost Variance by Department
-
Actual Cost by Department
-
Average Delay by Department
This view highlights departments causing delays or cost overruns.
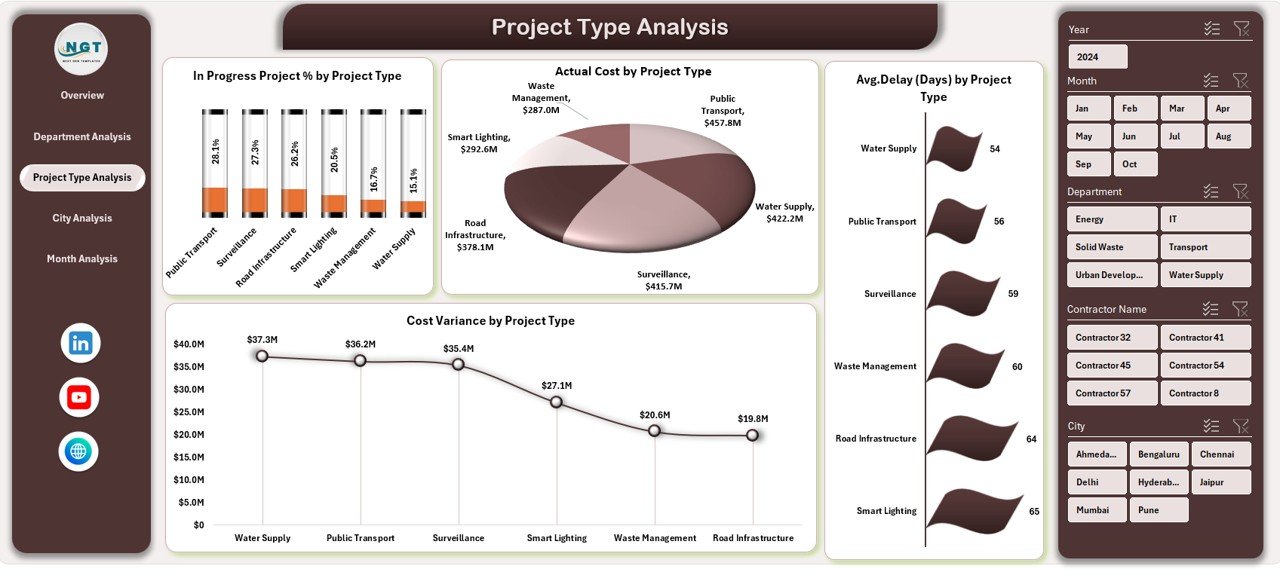
📄 Project Type Analysis Page
Analyzes performance by project category.
Includes:
-
In Progress Project % by Project Type
-
Actual Cost by Project Type
-
Average Delay by Project Type
-
Cost Variance by Project Type
Supports smarter planning for infrastructure, utilities, digital, and service projects.
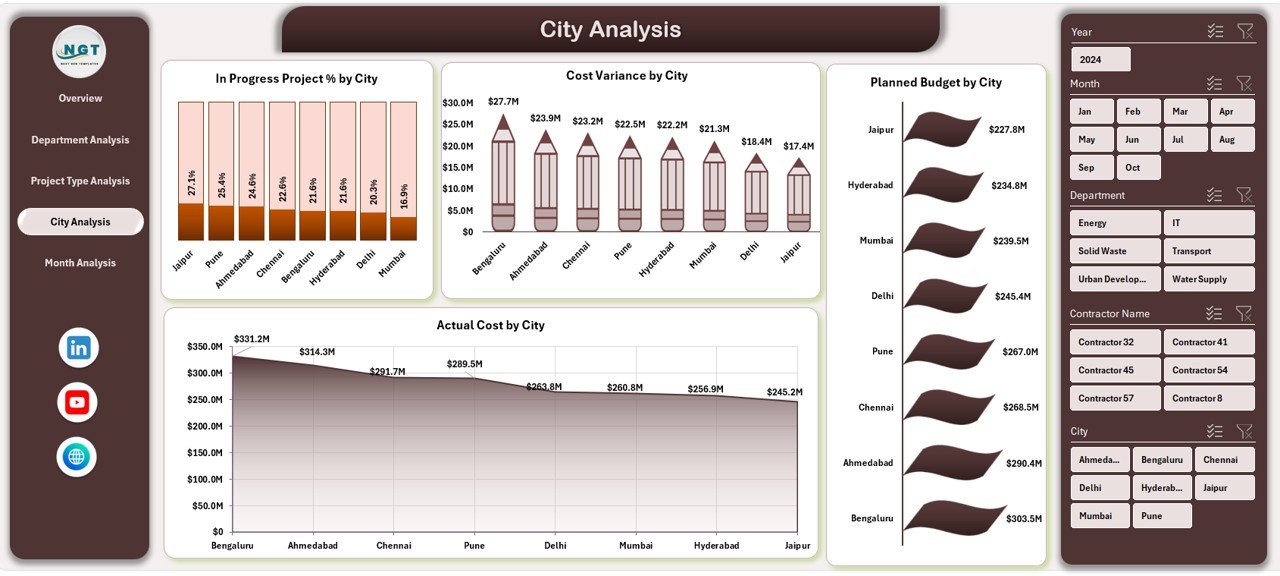
📄 City Analysis Page
Compares performance across multiple cities or regions.
Includes:
-
In Progress Project % by City
-
Cost Variance by City
-
Planned Budget by City
-
Actual Cost by City
Helps authorities benchmark cities and prioritize corrective actions.
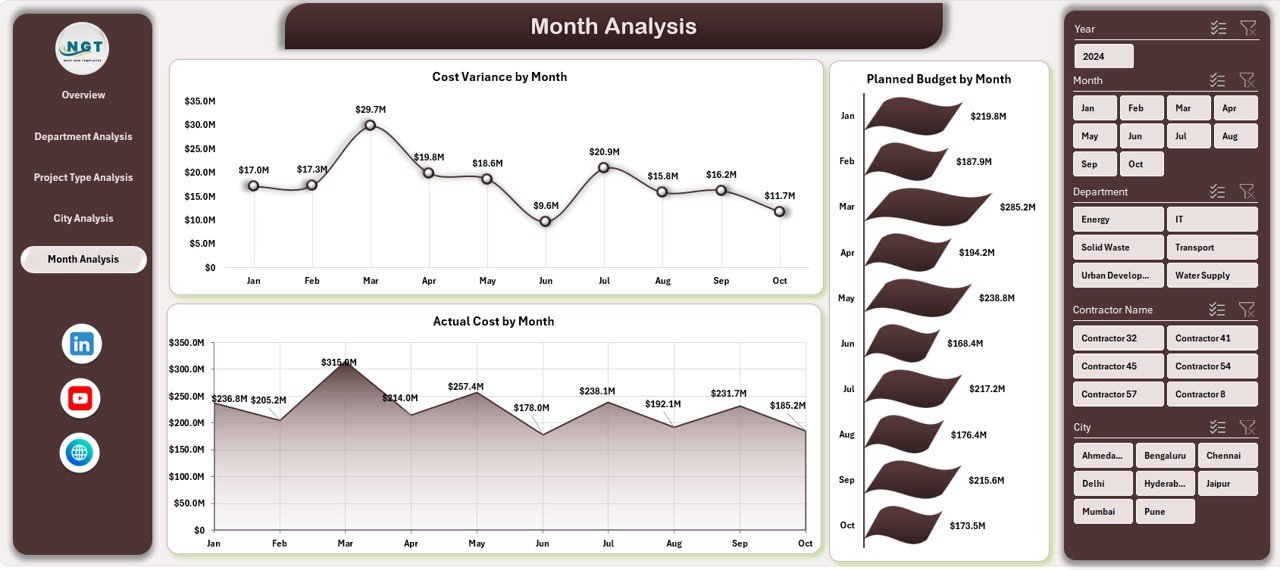
📄 Month Analysis Page
Tracks project performance trends over time.
Includes:
-
Cost Variance by Month
-
Planned Budget by Month
-
Actual Cost by Month
Supports forecasting, seasonal analysis, and proactive planning.
📄 Data Sheet & Support Sheet
-
Data Sheet stores all project data such as city, department, project type, budgets, costs, delays, and status.
-
Support Sheet manages pivot tables, helper calculations, and stability of the dashboard.
How to Use the Smart Cities Project Management Dashboard in Excel 🛠️
1️⃣ Enter or update project data in the Data Sheet
2️⃣ Use slicers to filter by city, department, project type, or month
3️⃣ Review KPIs, cost variance, and delays instantly
4️⃣ Identify problem areas early
5️⃣ Use insights for reviews, audits, and planning
No advanced Excel skills are required. The dashboard is intuitive and ready to use.
Who Can Benefit from This Smart Cities Project Dashboard 👥
🏙️ City Authorities & Administrators – Monitor project execution clearly
🏛️ Urban Planners & Smart City Teams – Track multi-city initiatives
📊 PMOs & Project Managers – Improve delivery performance
💰 Finance & Audit Teams – Control budgets and variance
👔 Government Agencies & Consultants – Support data-driven governance
Ideal for multi-department and multi-city smart city programs.


Reviews
There are no reviews yet.