


Managing refinery projects requires precision, speed, and complete visibility. Refinery projects often involve high capital investment, strict safety requirements, multiple departments, and tight timelines. When project data is scattered across spreadsheets and manual reports, tracking progress becomes difficult, risks increase, and decision-making slows down.
That is exactly why the Refinery Project Management Dashboard in Excel is an essential solution. 🚀
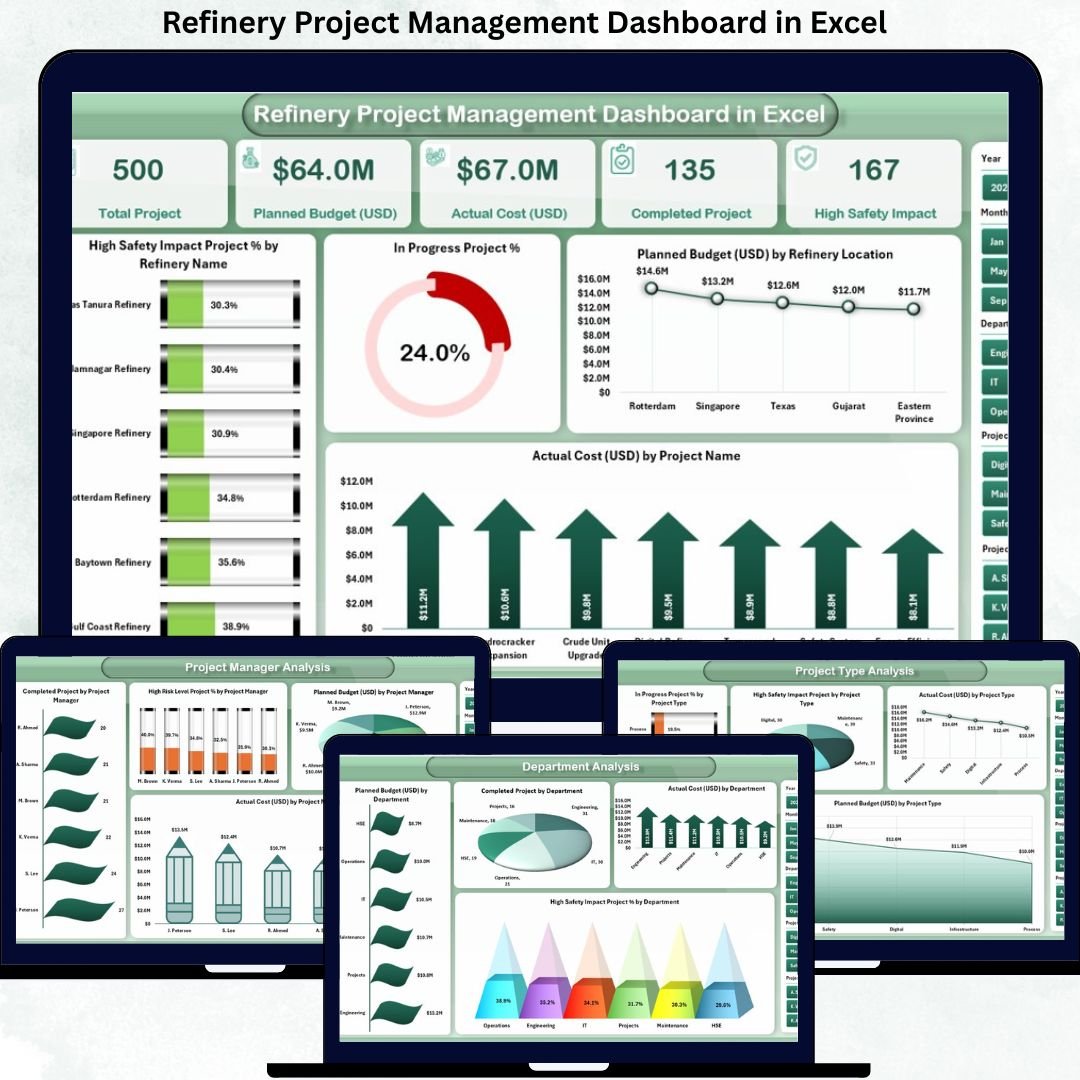
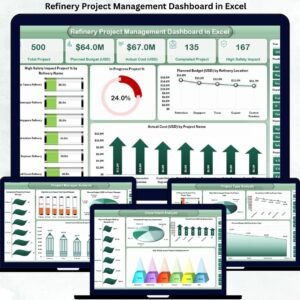
This professionally designed dashboard helps refinery teams monitor project performance, control costs, track safety impact, and evaluate progress—all from a single, easy-to-use Excel file.
Built specifically for refinery operations, this dashboard transforms complex project data into clear KPIs, dynamic charts, and actionable insights—without the need for expensive software or advanced technical skills.
Key Features of Refinery Project Management Dashboard in Excel 🔑
📊 Centralized Project Monitoring
Track all refinery projects in one dashboard with complete visibility into cost, safety, and performance.
📈 Interactive KPI Cards
Instantly view project health, budget utilization, cost performance, and safety impact.
🧭 Easy Page Navigation
Move between dashboard sections smoothly using a built-in page navigator.
📉 Department & Project Insights
Analyze performance by department, project manager, and project type.
📅 Monthly Performance Tracking
Monitor budget trends, project workload, and cost movement month by month.
⚡ Faster Decision Making
Visual insights help identify risks, delays, and cost overruns early.
💼 Management-Ready Reporting
Perfect for project reviews, audits, planning meetings, and leadership reporting.
What’s Inside the Refinery Project Management Dashboard in Excel 📁
This ready-to-use Excel dashboard includes five structured analytical pages, along with a data and support sheet for seamless operation.
📄 Overview Page
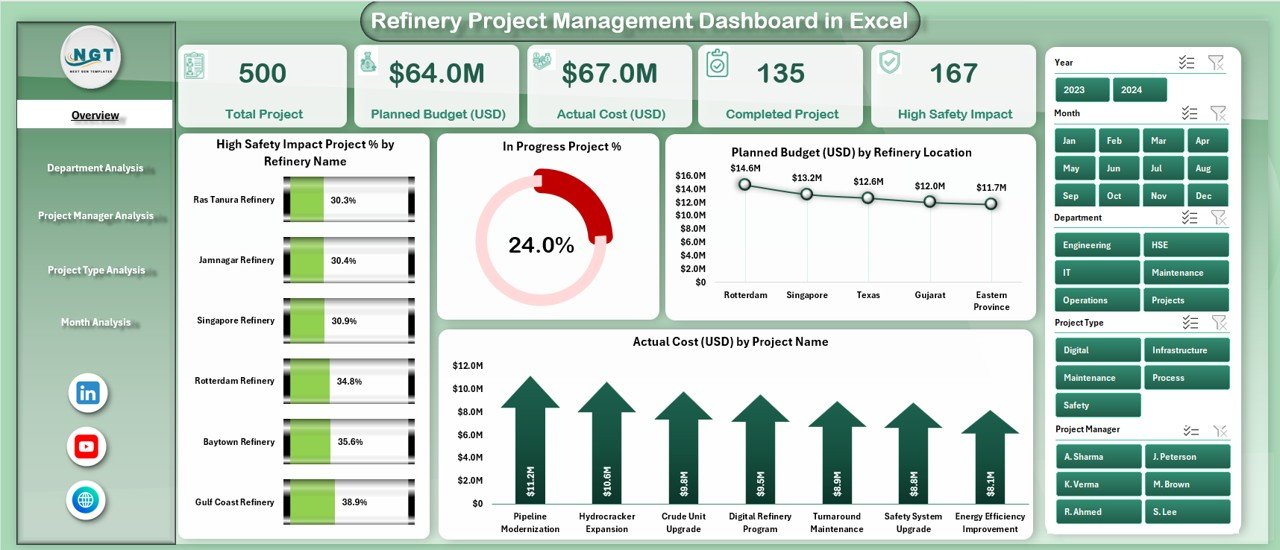
Provides a complete project snapshot with KPI cards and charts such as:
-
High Safety Impact Project % by Refinery
-
In-Progress Project %
-
Planned Budget by Refinery Location
-
Actual Cost by Project Name
📄 Department Analysis Page
Evaluates performance across departments using:
-
Planned Budget by Department
-
Completed Projects by Department
-
Actual Cost by Department
-
High Safety Impact % by Department
📄 Project Manager Analysis Page
Tracks individual performance using:
-
Completed Projects by Project Manager
-
High Risk Project %
-
Planned Budget Responsibility
-
Actual Cost by Project Manager
📄 Project Type Analysis Page
Analyzes projects by category with:
-
In-Progress Projects by Type
-
High Safety Impact by Type
-
Actual Cost by Project Type
-
Planned Budget by Project Type
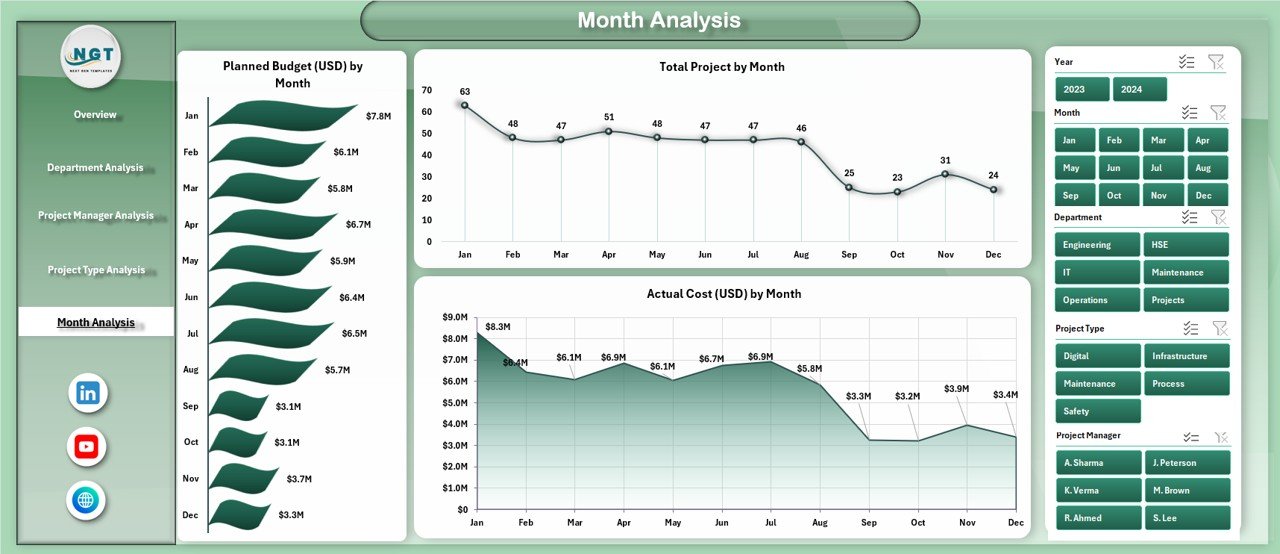
📄 Month Analysis Page
Shows time-based trends using:
-
Planned Budget by Month
-
Total Projects by Month
-
Actual Cost by Month
📄 Data & Support Sheets
Store project data, dropdown lists, calculations, and helper tables to ensure smooth performance.
How to Use the Refinery Project Management Dashboard in Excel 🛠️
1️⃣ Enter project details in the Data Sheet
2️⃣ Select filters such as refinery, department, or month
3️⃣ View KPIs and charts update automatically
4️⃣ Analyze cost, safety, and performance trends
5️⃣ Use insights for planning and reporting
No coding or advanced Excel knowledge is required. The dashboard is fully automated and user-friendly.
Who Can Benefit from This Refinery Project Management Dashboard 👥
🏭 Refinery Project Managers – Track progress and performance easily
📊 Operations Managers – Monitor project execution and risks
💰 Finance Teams – Control budgets and analyze cost variance
⚠️ Safety Officers – Identify high-risk projects early
📈 Senior Management – Make data-driven decisions confidently
Whether managing a single project or multiple refinery operations, this dashboard fits perfectly.


Reviews
There are no reviews yet.