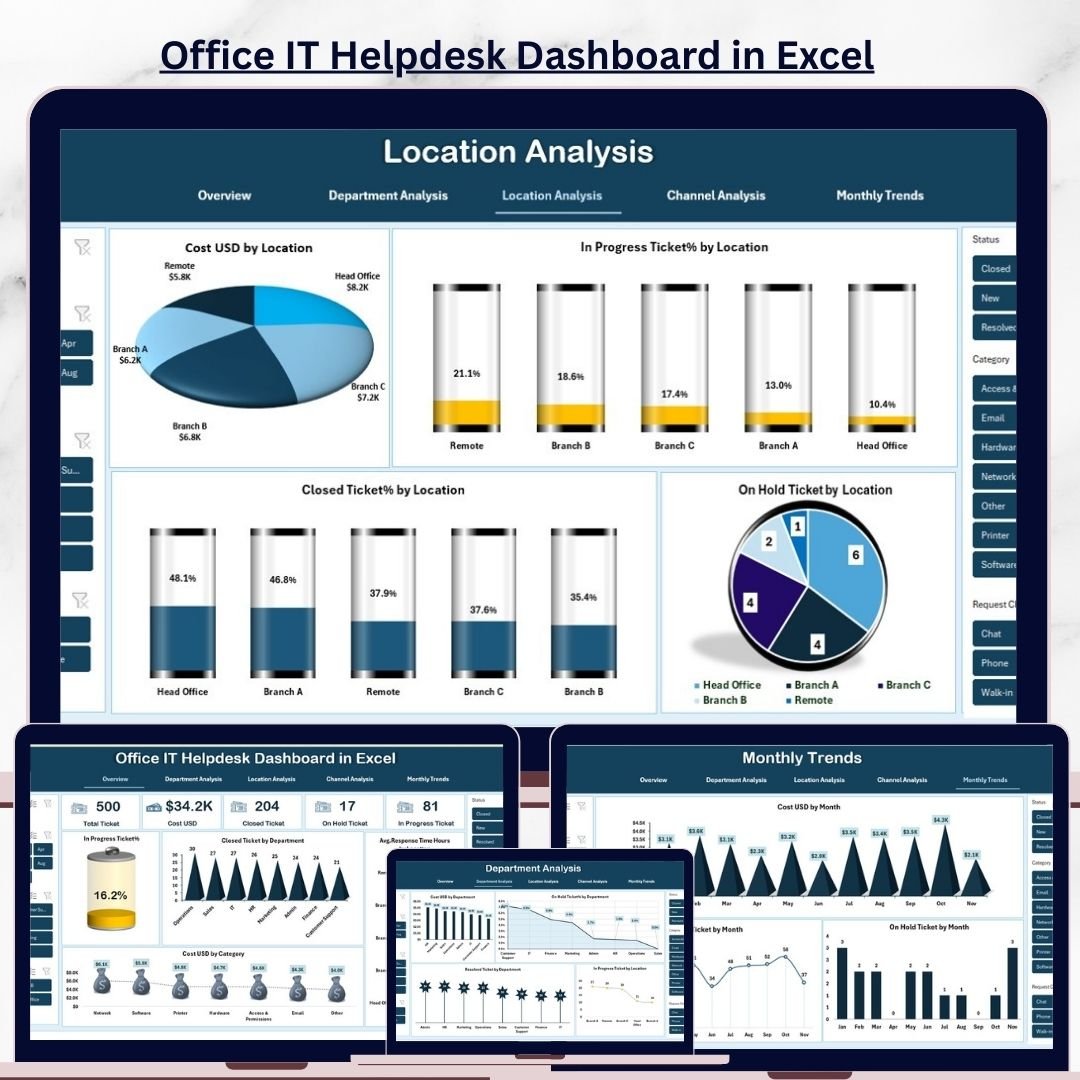
Managing IT tickets manually leads to overwhelming delays, scattered data, slow decisions, and invisible cost leaks. If your organization struggles with increasing IT issues, slow response times, and repeated problems, the Office IT Helpdesk Dashboard in Excel is the solution you have been waiting for. This powerful, ready-to-use Excel template transforms raw helpdesk data into clean visuals, actionable KPIs, and easy-to-read insights—without any coding or complex tools.
Whether you handle employee queries, system errors, software requests, or network failures, this dashboard gives you instant clarity. You simply update your monthly data, select the period, and the entire dashboard refreshes automatically. From daily monitoring to monthly reporting, this template gives IT managers total control over performance, cost, workload, and service quality.
With smart visuals, automated calculations, and multi-dimensional analysis, this Excel dashboard becomes your central command center for IT operations.
🚀 Key Features of the Office IT Helpdesk Dashboard in Excel
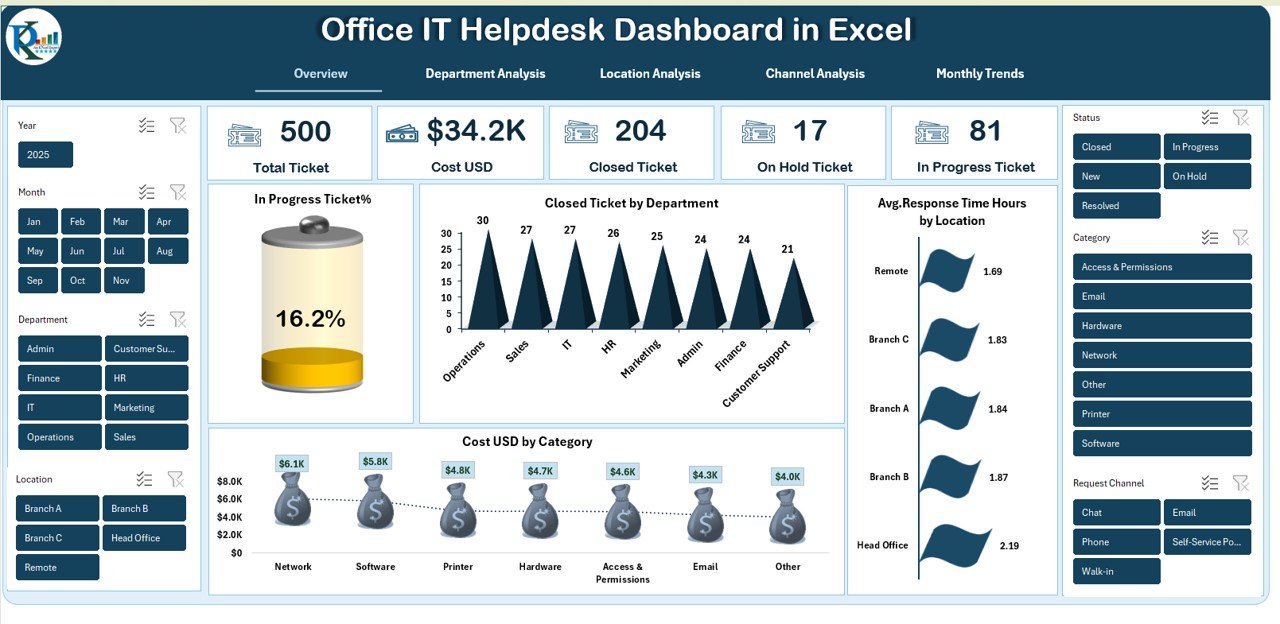
✔️ 360° IT Performance View
All your major KPIs—Total Tickets, Closed Tickets, On-Hold Tickets, Cost, In-Progress %, and more—displayed neatly in one place.
✔️ Automated Visual Dashboards
Dynamic charts update instantly for departments, locations, categories, and channels.
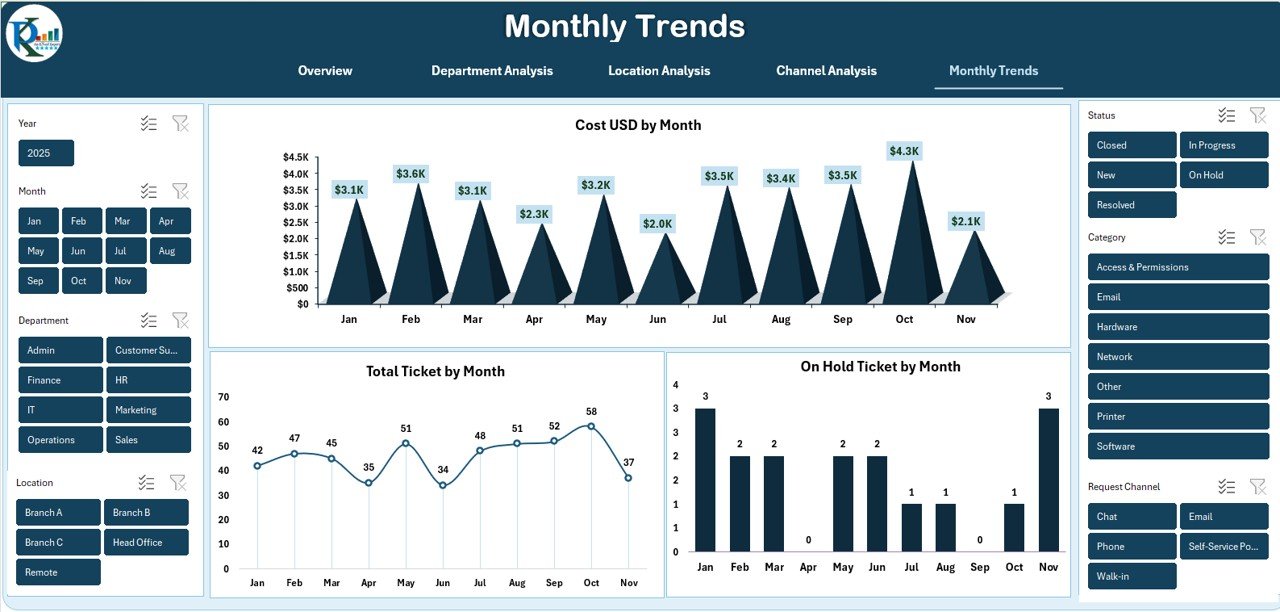
✔️ Trend Analysis for Smarter Planning
Track monthly cost, ticket volume, and bottlenecks to improve forecasting.
✔️ Department & Location Insights
Identify high-cost teams, slow-performing branches, and workload imbalances.
✔️ Channel Performance Evaluation
Compare ticket response time and closure efficiency across Email, Phone, Portal, and Chat.
✔️ Zero Coding, 100% Excel-Based
Designed for professionals who want powerful insights without learning advanced tools.
📦 What’s Inside the Office IT Helpdesk Dashboard
🔹 Overview Page – The Main Dashboard
A clean, professional summary showing total activity, service performance, and cost insights.
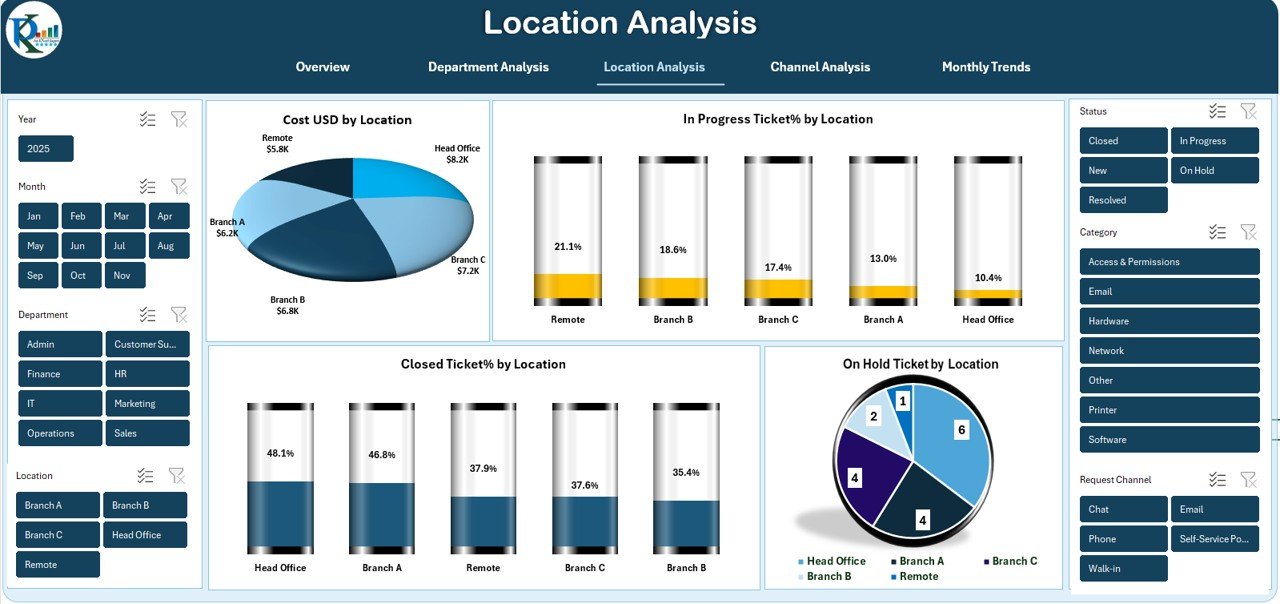
🔹 Location Analysis Sheet
Understand which branches consume more cost, keep more tickets pending, or need faster responses.
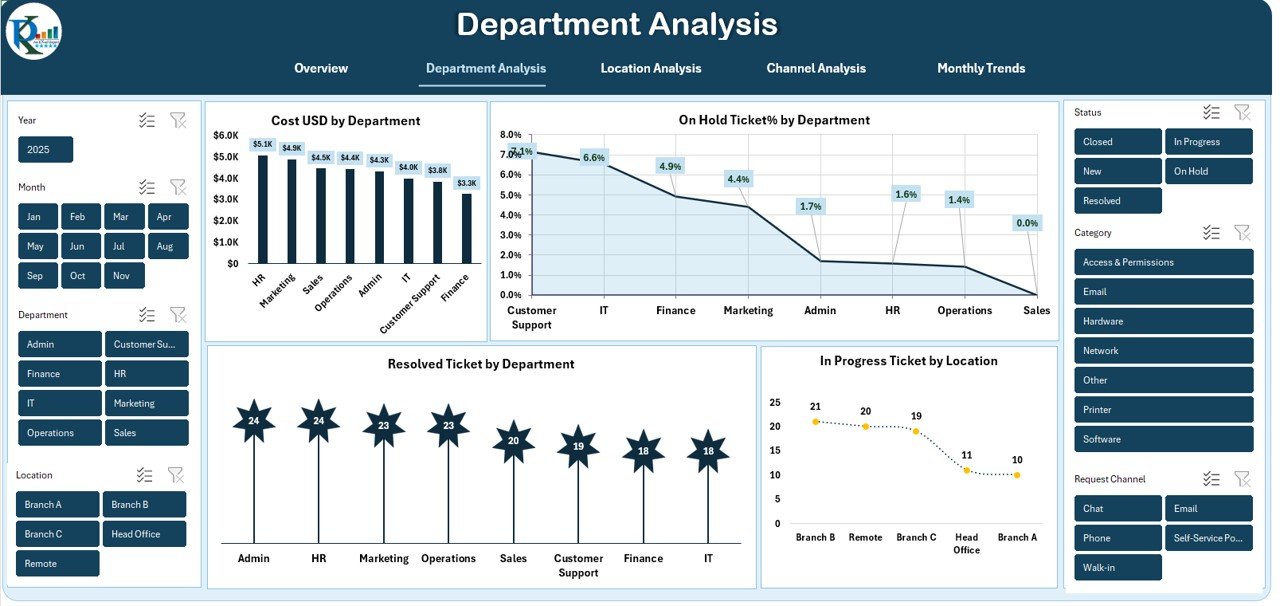
🔹 Department Analysis Sheet
Evaluate budget usage, issue patterns, and efficiency across all internal teams.
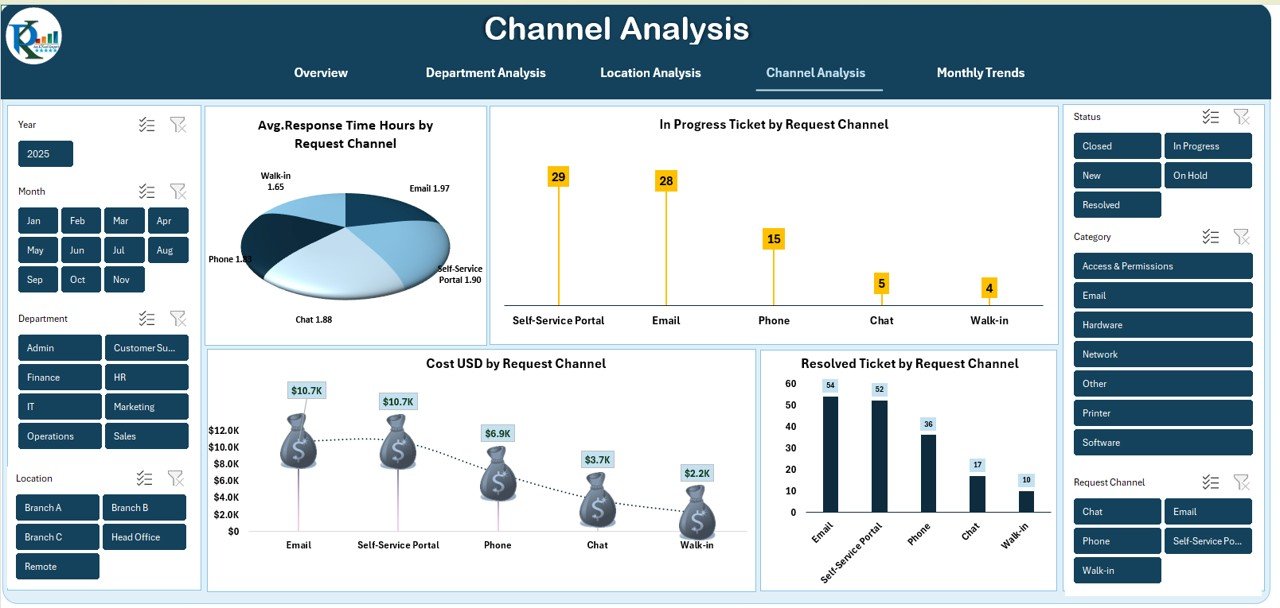
🔹 Channel Analysis Sheet
See which request channel performs better and where improvements are needed.
🔹 Monthly Trends Sheet
Spot seasonal patterns and long-term helpdesk behavior for strategic planning.
🔹 Fully Structured Sample Data
Comes with a clean data backend so you can plug in your organization’s numbers instantly.
🛠️ How to Use the Office IT Helpdesk Dashboard
▶️ Step 1 – Update Your Data
Enter or paste your monthly ticket records into the given data table.
▶️ Step 2 – Select the Month
Choose the desired period from the dropdown menu.
▶️ Step 3 – Refresh the Dashboard
All KPIs, charts, and comparisons update automatically.
▶️ Step 4 – Review Each Sheet
Use Overview, Location, Department, Channel, and Monthly Trend tabs for 360° analysis.
▶️ Step 5 – Take Action
Use the insights to improve response time, balance workloads, and reduce operational cost.
No technical skills required—it’s designed for complete ease of use.
🎯 Who Can Benefit from This Dashboard
👨💼 IT Managers
Track SLA performance, spot delays, and monitor workload in real time.
🖥️ Support Engineers
Understand daily ticket volume and prioritize tasks effectively.
🧑💻 IT Analysts
Perform cost analysis, identify patterns, and improve reporting speed.
🏢 Operations & Admin Teams
Get clear visibility into IT issues across departments and locations.
📊 Senior Leadership
Review monthly progress without reading long or complex reports.
Whether your company has 50 tickets a month or 5,000, this dashboard works perfectly for all organization sizes.
### Click here to read the Detailed blog post
Watch the step-by-step video tutorial:


Reviews
There are no reviews yet.