

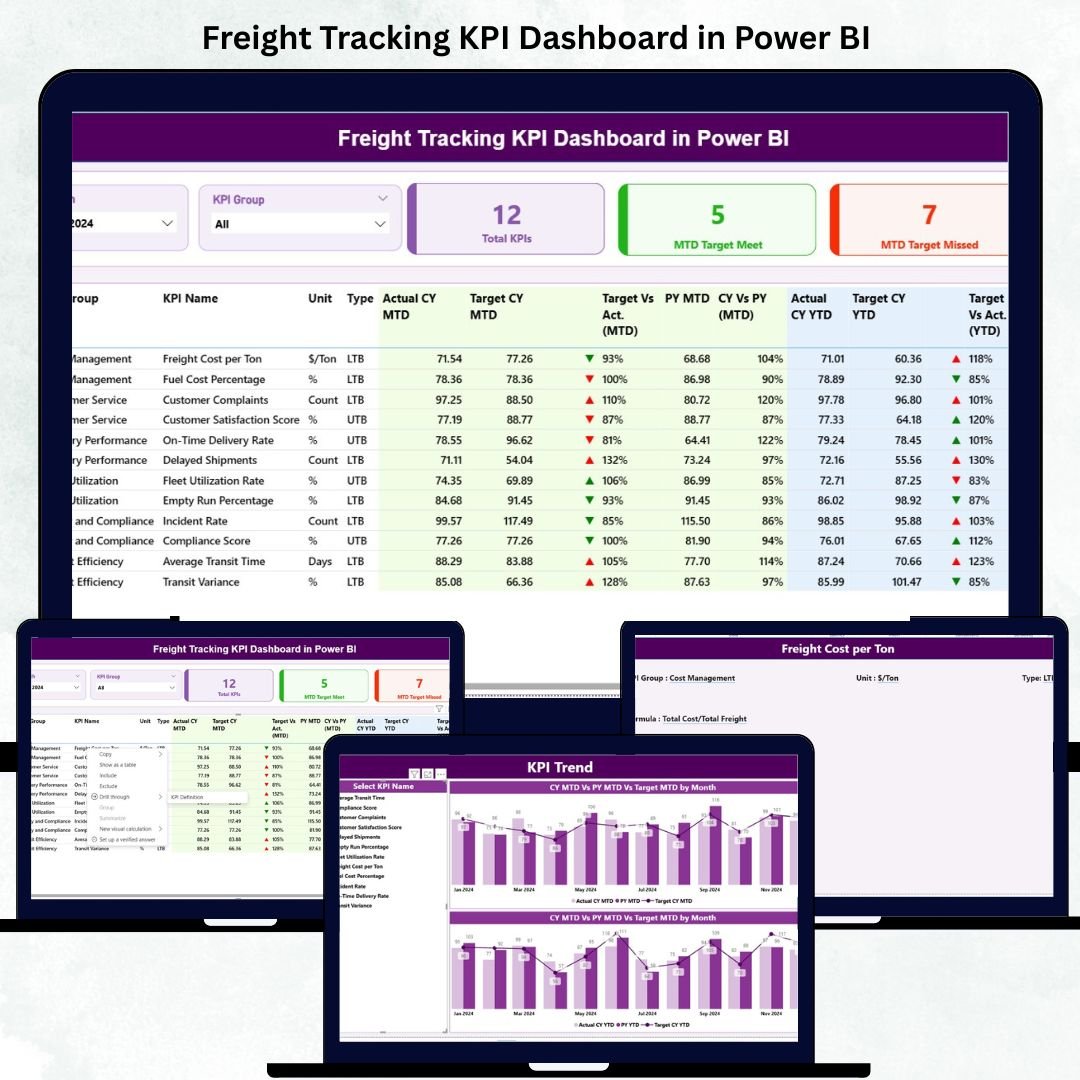

In the fast-paced world of logistics and freight operations, data accuracy and real-time performance tracking are key to achieving efficiency and profitability. The Freight Tracking KPI Dashboard in Power BI . is a ready-to-use analytical tool that transforms complex freight data into clear, actionable insights — empowering logistics teams to make smarter, faster, and data-driven decisions.
Built with Microsoft Power BI, this dashboard provides a unified view of shipment performance, delivery times, and freight costs, making it easier than ever to monitor, compare, and optimize key logistics metrics.
✨ Key Features of Freight Tracking KPI Dashboard in Power BI
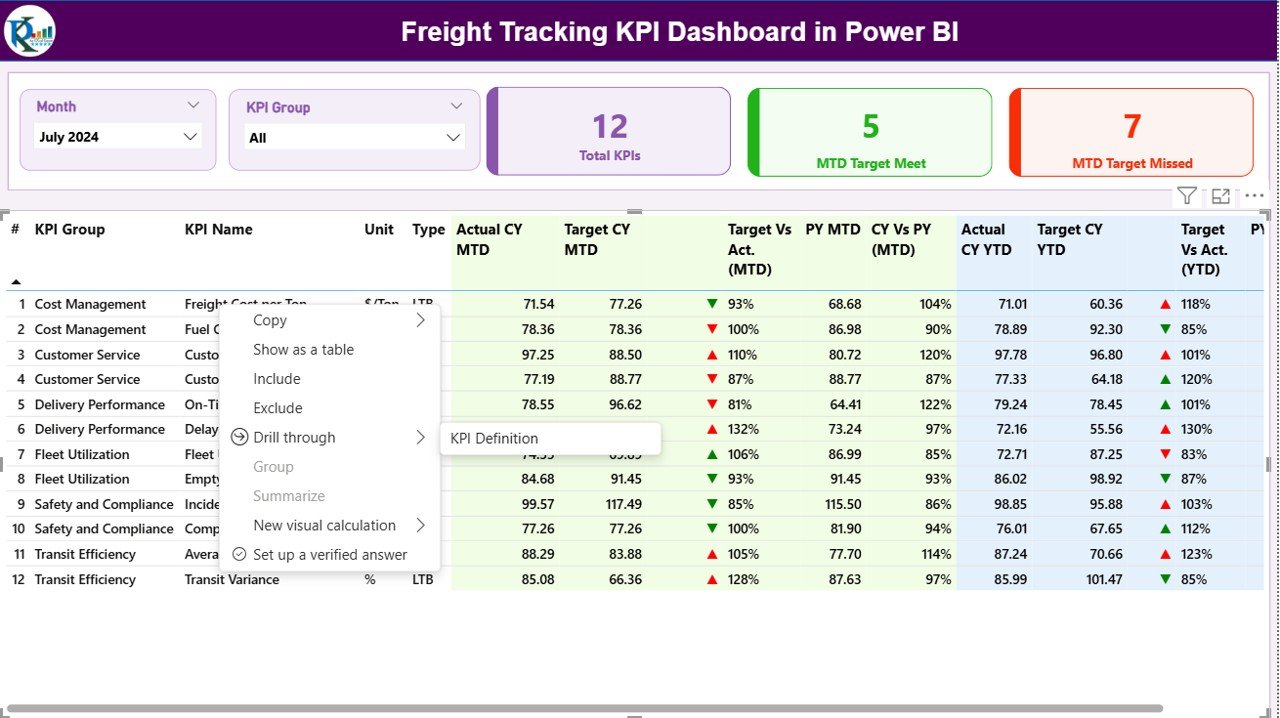
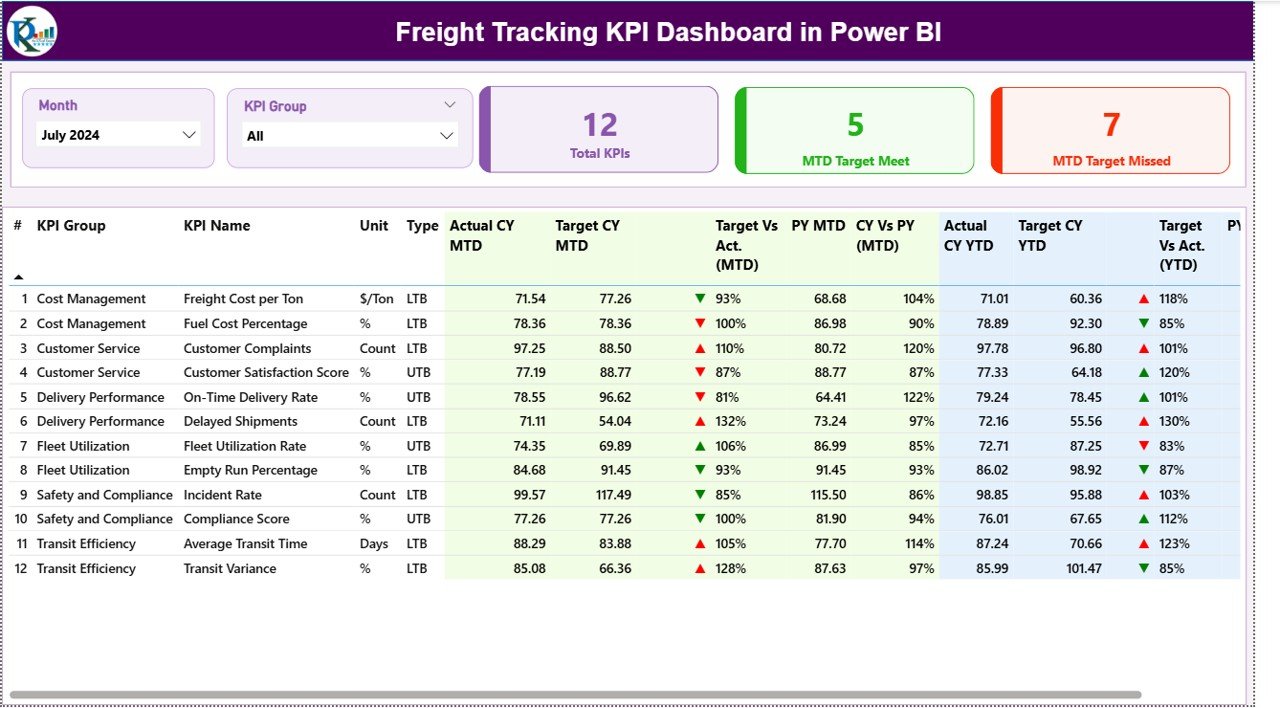
✅ Dynamic Visualization: View all KPIs in one place with interactive visuals that respond instantly to slicers for Month and KPI Group.
✅ Performance Cards: Instantly see the Total KPIs Count, MTD Target Met, and MTD Target Missed, giving you a snapshot of how your logistics operations are performing.
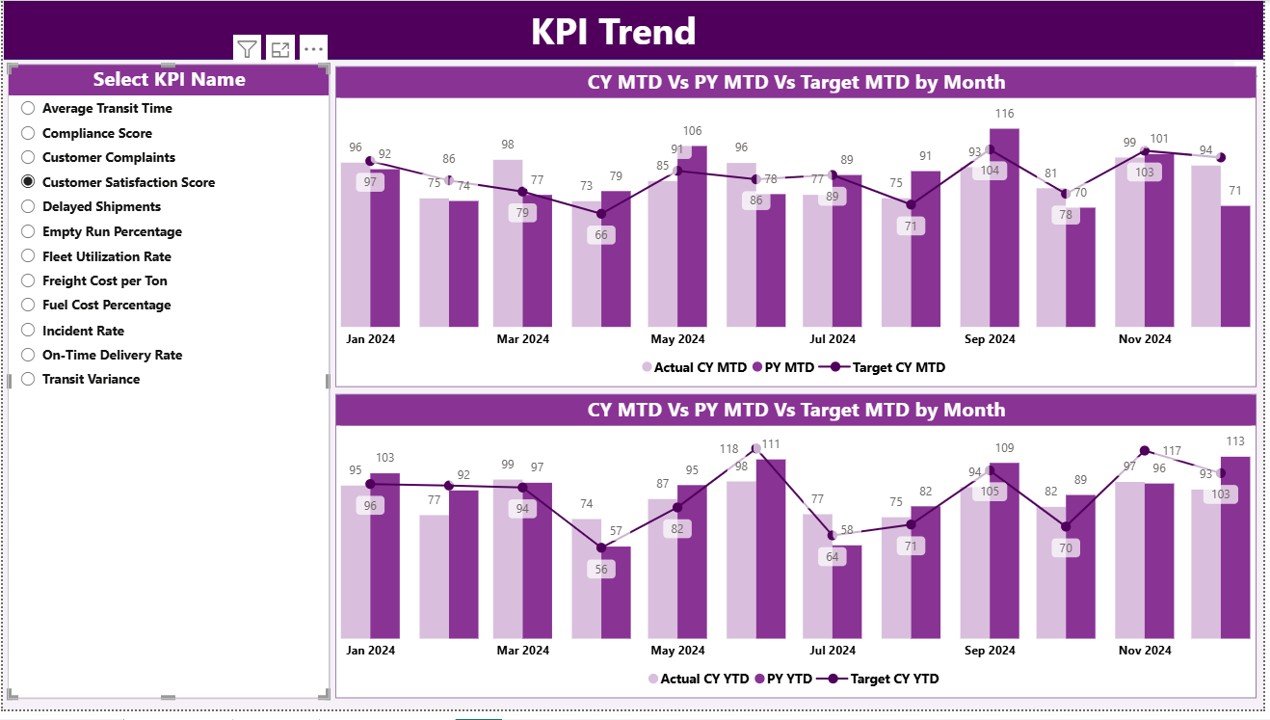
✅ Trend Analysis: Track Current vs Previous Year performance and Target vs Actual metrics for both MTD and YTD, helping identify trends, gaps, and opportunities.
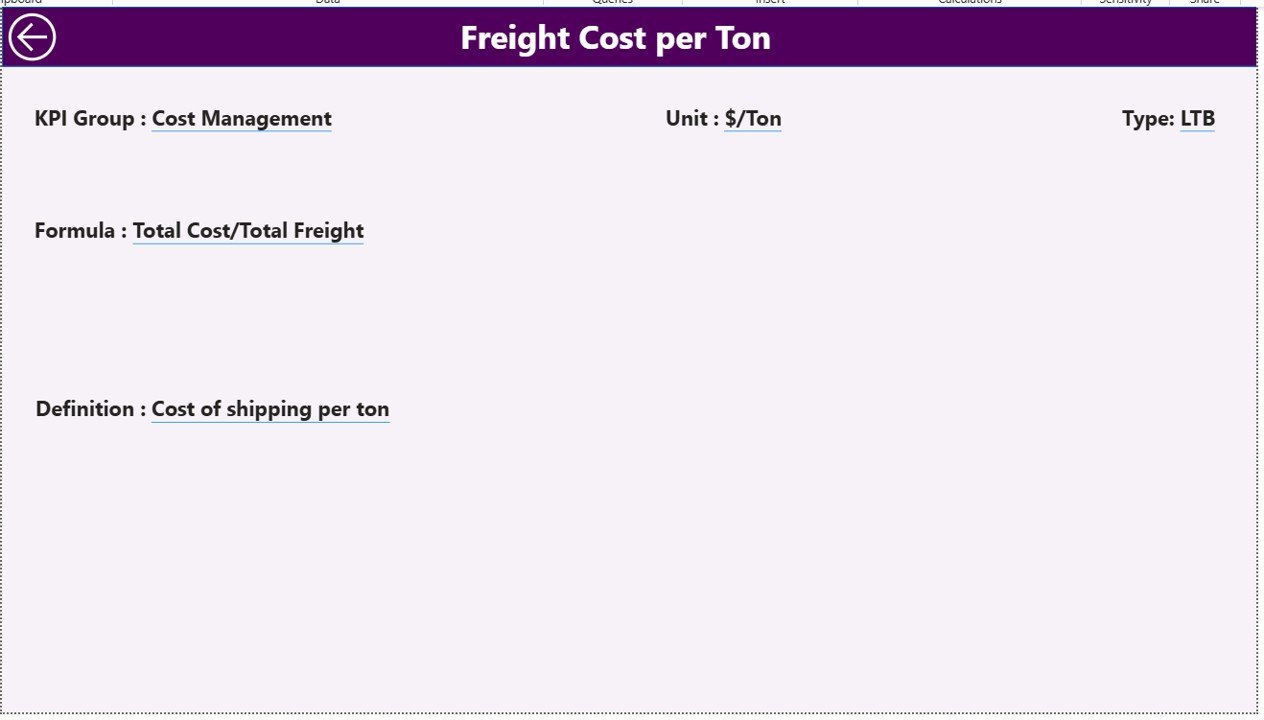
✅ Drill-Through Analysis: Deep dive into KPI definitions, formulas, and types (LTB/UTB) directly within the dashboard — no need to check external files.
✅ Excel Integration: The dashboard is powered by a linked Excel file, making it flexible and easy to update without technical expertise.
✅ Real-Time Updates: Refresh your visuals automatically through Power BI Service or scheduled gateway connections.
✅ Scalable Design: Easily add more KPIs, departments, or regions as your freight operations grow.
✅ Professional Look: Clean design, conditional formatting, and intuitive navigation make this dashboard perfect for executives, managers, and analysts alike.
📦 What’s Inside the Freight Tracking KPI Dashboard in Power BI
Inside this premium Power BI dashboard, you’ll find a comprehensive freight analysis system designed to simplify data tracking and enhance decision-making:
📄 Summary Page: The main control panel showing KPI cards, slicers, and a detailed table of performance data.
📈 KPI Trend Page: Compare freight metrics over time — visualize patterns, detect performance shifts, and forecast future outcomes.
📘 KPI Definition Page: Explore KPI details like formulas, definitions, and types to understand how performance is measured.
📊 Excel Data Source: Structured with three key sheets —
Input_Actual,Input_Target, andKPI_Definition, ensuring data consistency and automatic refresh.
Every component works seamlessly together to create a real-time, data-driven freight management solution that replaces manual reporting with automation and clarity.
🧭 How to Use the Freight Tracking KPI Dashboard in Power BI
1️⃣ Open the Power BI File and connect it to the linked Excel data source.
2️⃣ Update Monthly Data in the Excel sheets — Input_Actual, Input_Target, and KPI_Definition.
3️⃣ Refresh Power BI, and your dashboard updates instantly with the latest numbers.
4️⃣ Use slicers for Month and KPI Group to filter your data dynamically.
5️⃣ Drill through KPIs to analyze formula, definition, and performance type.
6️⃣ Share insights easily with your team through Power BI Service or PDF export.
💡 Tip: Keep Excel date formats consistent and use the first day of each month for accurate monthly analysis.
👥 Who Can Benefit from This Freight Tracking KPI Dashboard
🚛 Logistics Managers: Get instant visibility into MTD/YTD achievements and underperforming KPIs.
🏭 Operations Heads: Analyze efficiency across departments, regions, and time periods.
📦 Freight Forwarders: Track shipment costs, delivery performance, and bottlenecks.
📊 Data Analysts: Dive deep into trend analysis and KPI benchmarking for better insights.
💼 Business Owners: Monitor overall logistics performance and align strategy with results.
Whether you run a freight forwarding company, manufacturing unit, or third-party logistics service, this Power BI dashboard helps you optimize performance, cut costs, and make data-backed decisions effortlessly.
Click here to read the Detailed Blog Post
Watch the step-by-step video tutorial:
Visit our YouTube channel to learn step-by-step video tutorials — YouTube.com/@PKAnExcelExpert
Compatibility and Requirements
- Works in Power BI Desktop, which is free. Microsoft explains how to get it in Get Power BI Desktop.
- The data comes from a linked Excel file with three sheets: Input_Actual, Input_Target and KPI_Definition.
- Refreshing through Power BI Service or a scheduled gateway connection is also supported.
Frequently Asked Questions
Which pages are included?
Three pages: Summary, KPI Trend and KPI Definition. The Summary page has the KPI cards, the slicers and a detailed table.
Where do I enter my data?
Enter monthly actuals in the Input_Actual sheet and targets in the Input_Target sheet of the linked Excel file. KPI names, formulas and types go in the KPI_Definition sheet. Then refresh Power BI.
Can I compare this year with last year?
Yes. The KPI Trend page shows Current vs Previous Year and Target vs Actual for both MTD and YTD.
Can I filter by month or KPI group?
Yes. Slicers for Month and KPI Group filter the whole dashboard.
Is there an Excel version?
Yes. See the Freight Tracking KPI Dashboard in Excel.
Related Freight and Logistics Templates
- Freight Tracking KPI Dashboard in Excel: the same freight KPIs in Excel
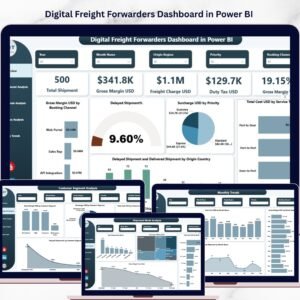
- Digital Freight Forwarders Dashboard in Power BI: a Power BI dashboard for freight forwarders
- Freight Cost KPI Dashboard in Excel: a cost-focused freight view
- Freight Forwarding Dashboard in Excel: a forwarding dashboard in Excel
- Logistics and Transportation Hub: 7 logistics templates in one download
Browse all Power BI KPI dashboards.




























Reviews
There are no reviews yet.