


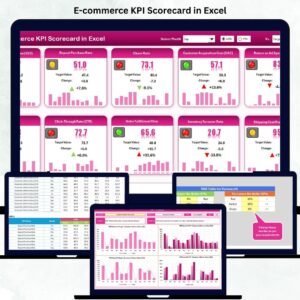
Running an online store without a clear view of your numbers is like driving with fogged-up glass. The E-commerce KPI Scorecard in Excel wipes it clean—so you can track sales, marketing, operations, and customer experience in one powerful, ready-to-use template. Built for Shopify, WooCommerce, Magento, marketplaces, and D2C brands, this scorecard converts raw data into laser-focused insights for targets, trends, and execution. No coding. No BI tools. Just Excel—done right. 📈
Key Features of the E-commerce KPI Scorecard in Excel ✨
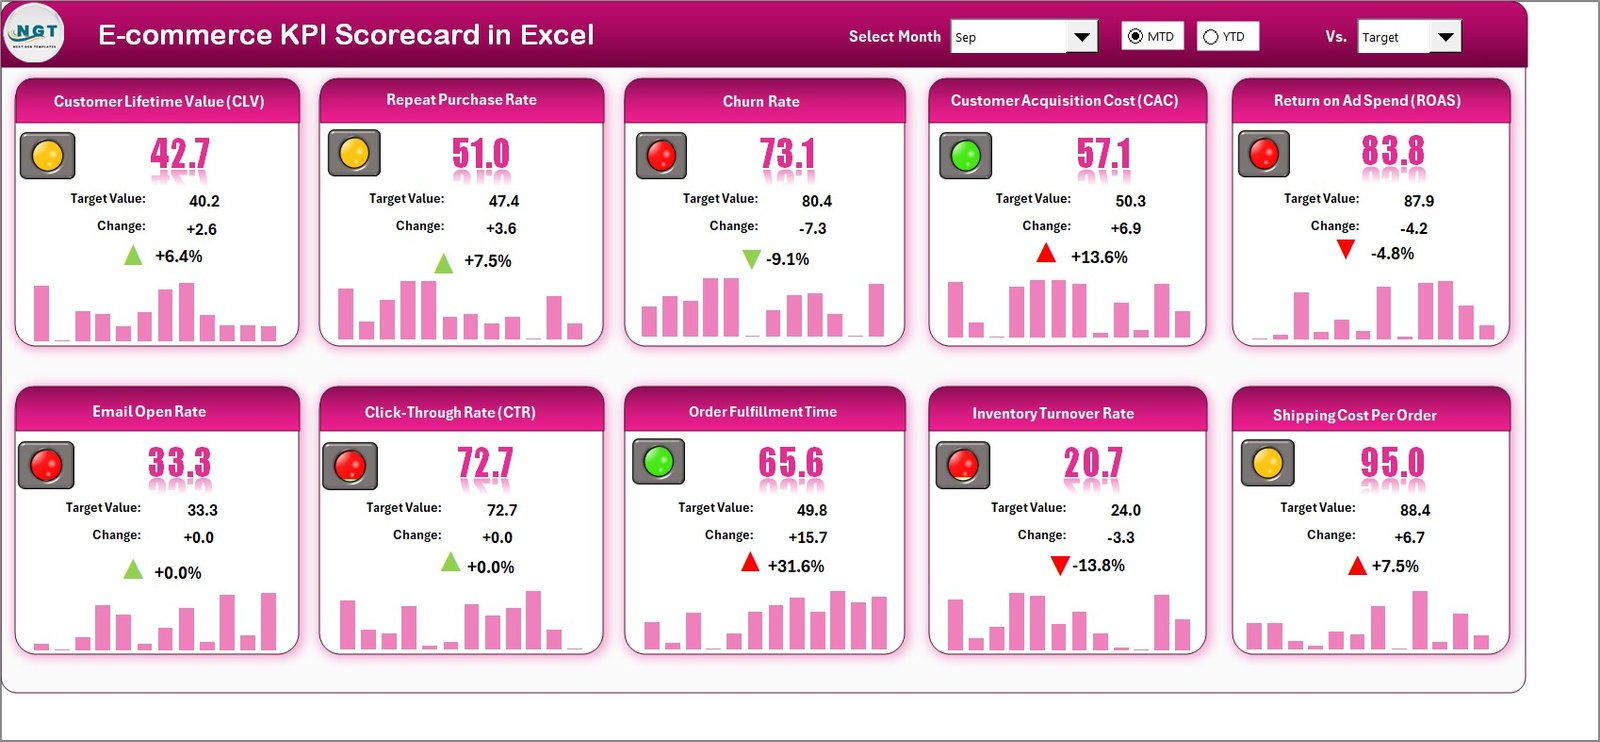
MTD & YTD Performance at a Glance: Use smart dropdowns to switch between Month-to-Date and Year-to-Date views instantly—perfect for reviews and standups.
Clear Actual vs Target Comparison: See where you’re winning (or slipping) with crisp visuals and conditional formatting 🔴🟡🟢.
Up to 10 KPIs in One View: Track the most critical metrics side-by-side—Conversion Rate, AOV, CAC, Return Rate, Fulfillment Time, and more.
Built for Speed & Clarity: Minimal clicks, maximum insight. View, decide, act—fast.
Fully Editable: Customize KPI names, formulas, and groups to match your business model.
What’s Inside the E-commerce KPI Scorecard in Excel 🧩
Scorecard Sheet (Your Command Center):
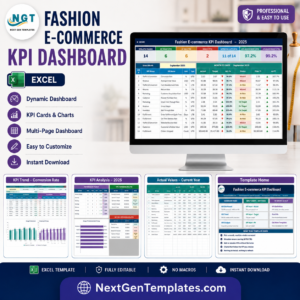
Choose any month, toggle MTD/YTD, and compare Actual vs Target vs Previous Year. It’s the clean, executive view your team will love.KPI Trend Sheet (Deep Dive):
Pick a KPI from the dropdown (cell C3) to reveal its Group, Unit, KPI Type (UTB/LTB), Formula, and Definition—plus trend charts for Actual, Target, and PY.Input Data Sheet (Fast Data Entry):
Enter Actuals and Targets by month/category/region. As you update, all pages refresh instantly—no extra steps.KPI Definition Sheet (Your Reference Hub):
Keep every metric consistent with clear Name, Group, Unit, Formula, and Definition. Ideal for onboarding and audit trails.
How to Use the E-commerce KPI Scorecard in Excel 🛠️
Load Your Data: Add monthly Actuals and Targets in the Input Data sheet (optionally segmented by category, region, or channel).
Set Your Goals: Ensure targets reflect business priorities (e.g., reduce CAC, lift conversion, improve dispatch time).
Analyze the Scorecard: Switch months and MTD/YTD to review performance in meetings.
Explore Trends: Use the KPI Trend sheet to spot seasonality, dips, and momentum.
Take Action: Prioritize fixes—landing page optimization, ad ROAS tuning, inventory planning, or fulfillment speed.
Iterate & Scale: Customize KPIs and visuals as your store grows; the model is fully editable.
Who Can Benefit from This E-commerce KPI Scorecard 👥
Founders & CEOs: High-clarity executive view for weekly check-ins and investor updates.
E-commerce Managers: One hub for marketing + sales + ops performance—no scattered sheets.
Marketing Teams: Track CAC, ROAS, conversion rate, and email/social impact with confidence.
Ops & Fulfillment: Monitor pick/pack/ship time, return rate, and delivery SLAs.
Analysts & Account Managers: Standardized reporting your clients and stakeholders will trust.
Why It Works (and Wins) 🏆
Simple but Powerful: Excel-native, fast, familiar—no steep learning curve.
Decision-Ready: Color cues + compact layout = instant understanding.
Cost-Effective: Skip pricey BI suites; get professional analytics in a fraction of the time.
Future-Proof: Add new KPIs, rename fields, change formulas—your way.
Real KPIs You Can Track Today 📊
Sales: Revenue, AOV, Orders, Repeat Purchase Rate
Marketing: Conversion Rate, CAC, ROAS, Email CTR
Operations: Order Fulfillment Time, On-Time Delivery %, Return Rate
Customer Experience: CSAT, NPS, Support Resolution Time
Bottom line: If you want a single source of truth for your store’s performance—built in Excel and ready to act on—the E-commerce KPI Scorecard is your unfair advantage. 🧠⚡
























Reviews
There are no reviews yet.