

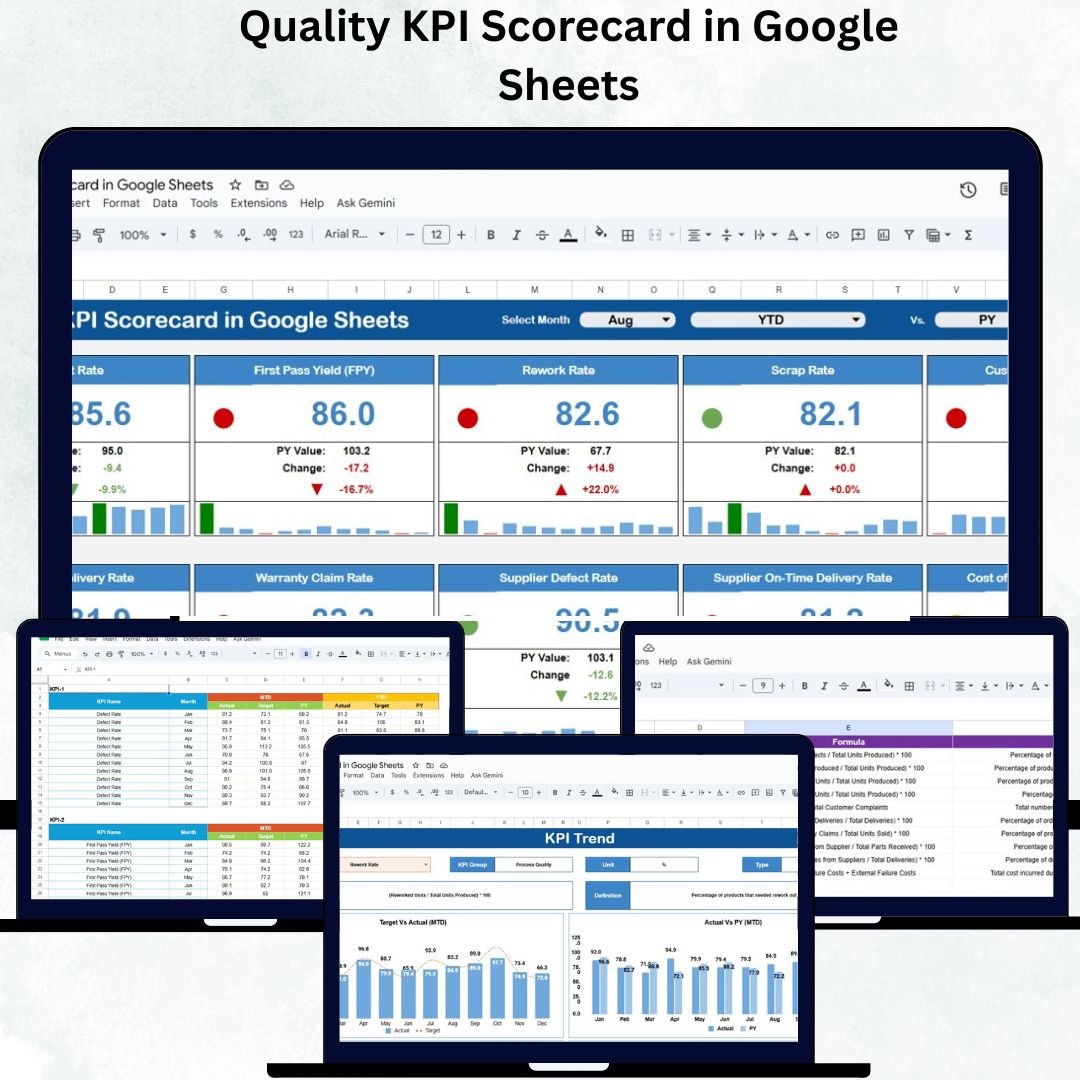

Quality assurance is the foundation of operational excellence. The Quality KPI Scorecard in Google Sheets is a ready-to-use, interactive tool designed to help businesses monitor, measure, and improve quality performance in real time.
Built entirely in Google Sheets, this scorecard consolidates your organization’s critical quality metrics — from defect rates and customer satisfaction to production efficiency — into one powerful visual dashboard. It enables quality managers, production heads, and compliance teams to make informed decisions and ensure continuous improvement without needing any additional software or coding.
📘 What Is a Quality KPI Scorecard in Google Sheets?
A Quality KPI Scorecard is a dynamic performance-tracking tool that captures and visualizes key quality indicators (KPIs) across various departments or projects.
It helps organizations:
Track and compare Actual vs Target performance for each KPI
View data in Month-to-Date (MTD) or Year-to-Date (YTD) formats
Identify improvement areas instantly through visual alerts and trend arrows
Because it’s cloud-based, multiple team members can update and view it simultaneously, ensuring real-time collaboration and transparent reporting.
📊 Scorecard Sheet Tab Overview
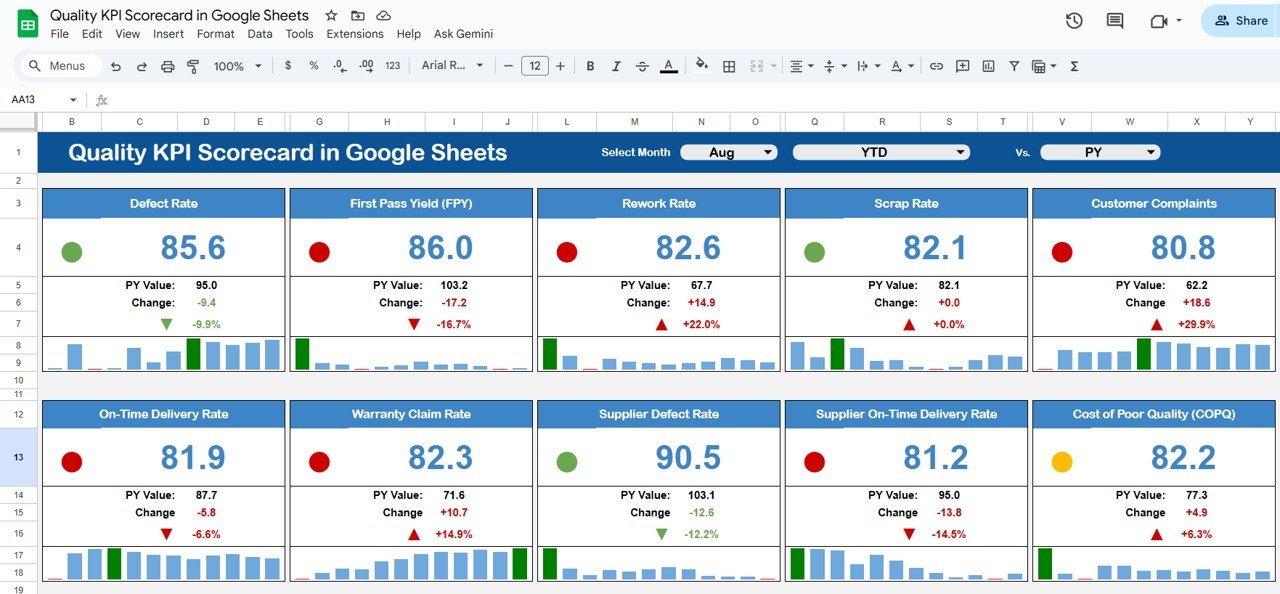
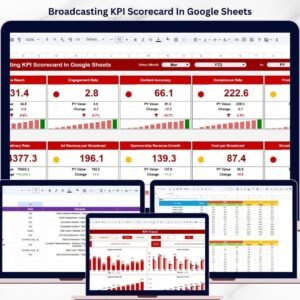
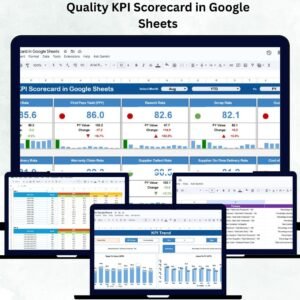
The Scorecard Sheet serves as the main dashboard, offering a visual snapshot of organizational quality performance.
🔹 Key Features
Month Selector (Cell D3): Select any month to instantly update all KPI visuals.
MTD/YTD Toggle: Switch between monthly and yearly views with one click.
Traffic Light Indicators:
🟢 Green = Target Achieved
🟡 Yellow = Slightly Below Target
🔴 Red = UnderperformanceTrend Arrows: Show improvement or decline vs previous month with percentage change.
Every visual element updates automatically based on the data in the backend sheets, ensuring accurate, real-time performance monitoring.
📈 KPI Trend Sheet Tab
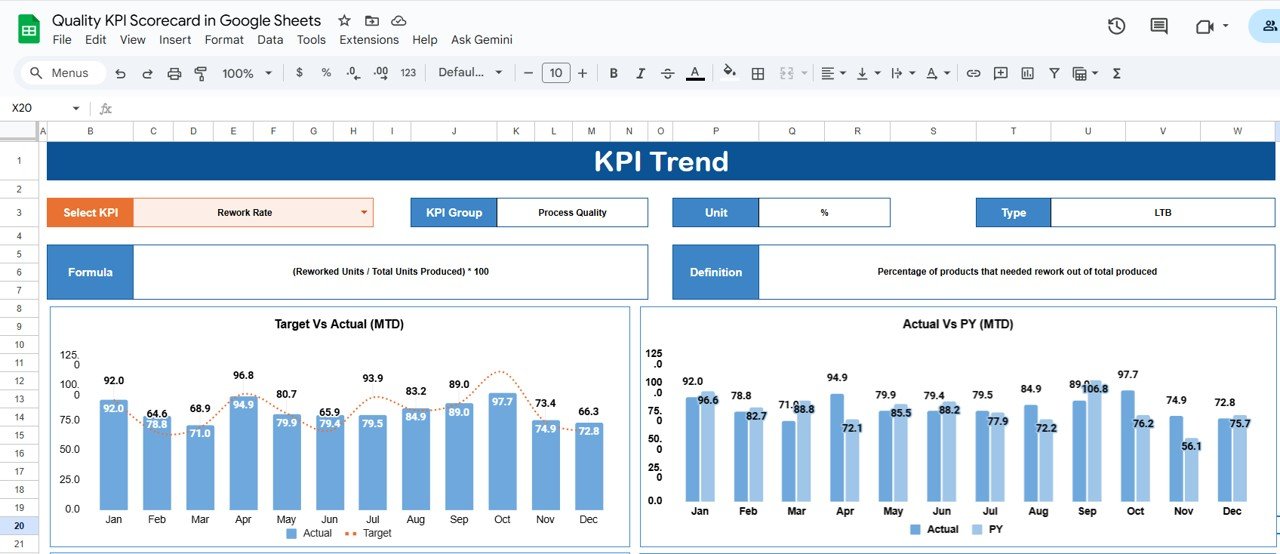
The KPI Trend Sheet provides in-depth performance insights for individual KPIs over time.
Features:
Dropdown Selector (Cell C3): Choose any KPI to visualize its performance history.
Displayed Details:
KPI Group (e.g., Product Quality, Customer Experience, Process Efficiency)
Unit (%, Count, or Score)
Formula and Definition
Type — UTB (Upper The Better) or LTB (Lower The Better)
Dynamic Chart: Displays KPI trends across months or quarters.
This sheet is invaluable for identifying recurring quality issues or long-term improvement patterns.
🧾 Data Input Sheet Tab
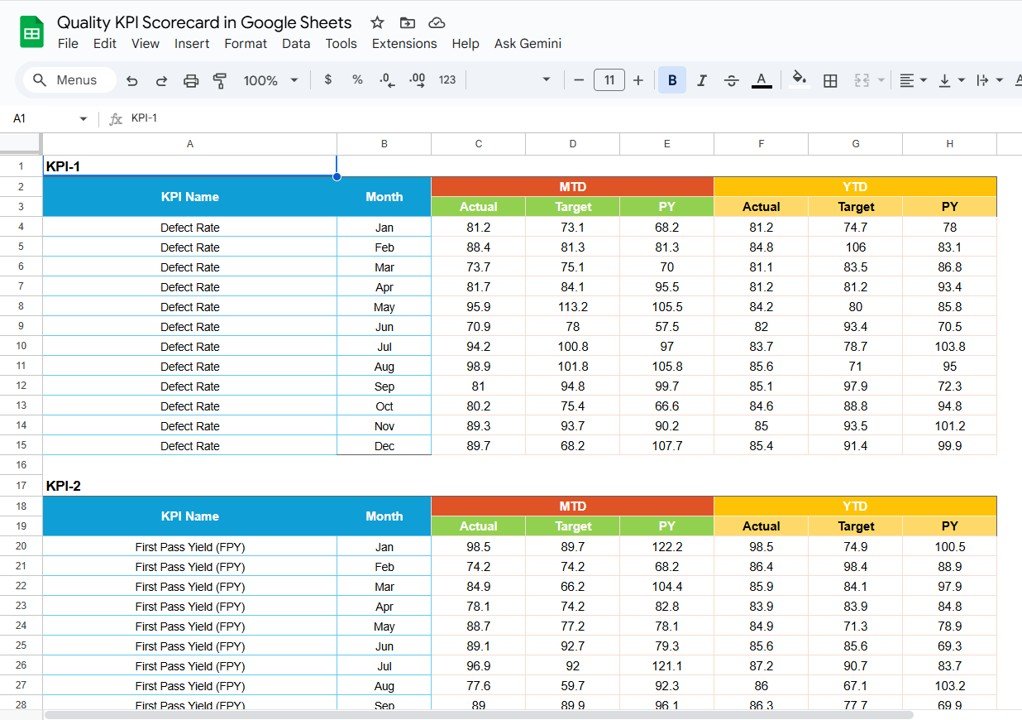
The Data Input Sheet is the foundation of the scorecard. It stores actual and target KPI data for each month.
Data Structure:
| KPI Name | Month | MTD Actual | MTD Target | YTD Actual | YTD Target |
As soon as you update a value, all visuals and calculations refresh automatically.
No manual recalculations or additional formulas are required.
This ensures your scorecard remains accurate, responsive, and maintenance-free.
📚 KPI Definition Sheet Tab
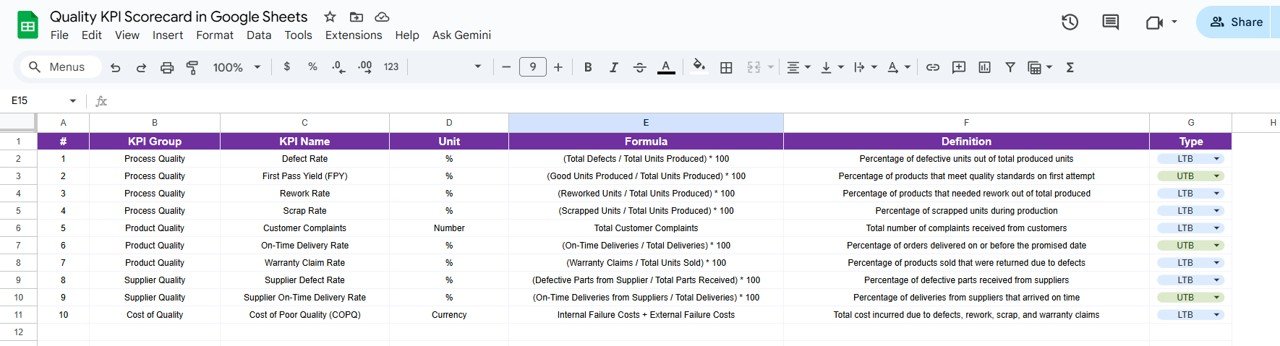
This tab defines every KPI used in the scorecard to maintain clarity and standardization.
Columns Include:
KPI Group (e.g., Manufacturing, Customer Feedback, Compliance)
KPI Name
Unit
Formula
Definition
Type (UTB/LTB)
By maintaining this reference, all users interpret metrics consistently across teams.
🎨 Color Settings
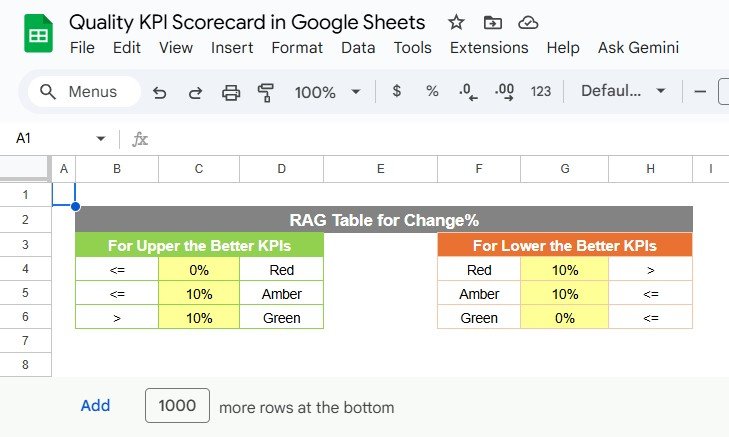
The Color Settings Sheet allows customization of threshold levels for KPI visualization.
Define your performance cut-offs for Good, Average, and Poor scores, and the traffic light indicators will automatically apply these rules.
🌟 Advantages of the Quality KPI Scorecard
📊 Real-Time Visualization: Instant performance monitoring for all KPIs.
⚙️ Automated Insights: Built-in logic for color coding and performance trends.
🧩 Customizable Structure: Add or modify KPIs as per business needs.
☁️ Cloud-Based Collaboration: Accessible to multiple users simultaneously.
✅ Accurate Reporting: Reduces manual calculation errors.
📅 MTD & YTD Views: Track both monthly and yearly progress easily.
🔍 Transparent Performance Tracking: Enhances management visibility.
🚀 Opportunities for Improvement
Enhance the dashboard’s capabilities with the following add-ons:
🔗 Automated Data Import: Connect with QA or production databases.
📧 Email Alerts: Notify stakeholders when KPIs fall below thresholds.
🔍 Drill-Down Filters: Enable department or project-level analysis.
🧾 CAPA Integration: Link corrective and preventive action logs.
📊 Looker Studio Integration: Upgrade visuals with advanced dashboards.
💡 Best Practices for Using the Scorecard
✅ Update Monthly: Enter data consistently to ensure reliable insights.
✅ Define KPIs Clearly: Keep definitions and formulas transparent.
✅ Set Realistic Targets: Align goals with achievable benchmarks.
✅ Monitor Trends: Review the KPI Trend tab for recurring issues.
✅ Control Access: Limit edit permissions to authorized quality personnel.
✅ Encourage Accountability: Use the dashboard in review meetings.
👥 Who Can Use This Scorecard
Quality Managers: Monitor production or service quality KPIs.
Operations Teams: Track process efficiency and defect trends.
Customer Service Heads: Evaluate satisfaction and complaint rates.
Compliance Officers: Ensure adherence to industry standards.
Executives: Gain a transparent view of quality performance across the organization.
✅ Conclusion
The Quality KPI Scorecard in Google Sheets is a comprehensive, visual, and automated tool for monitoring quality performance. With real-time updates, traffic lights, and trend indicators, it transforms static data into actionable insights.
It helps organizations uphold high standards, detect issues early, and ensure continuous improvement — all from within a simple, accessible, and collaborative Google Sheet.
If your goal is to drive quality excellence through data, this scorecard is your perfect solution.
🔗 Read the full guide and explore tutorials on
Watch the step-by-step video Demo:
YouTube.com/@NeotechNavigators
What’s Inside the Quality KPI Scorecard
- Scorecard sheet: month selector, MTD and YTD toggle, traffic light indicators and trend arrows.
- KPI Trend sheet: pick a KPI to see its group, unit, formula, type and trend chart.
- Data Input sheet: monthly MTD and YTD actuals and targets for each KPI.
- KPI Definition sheet: group, name, unit, formula, definition and type for every KPI.
- Color Settings sheet: your own cut-offs for Good, Average and Poor.
Compatibility and Requirements
- Works in Google Sheets with a free Google account and a web browser. Nothing to install.
- The month and KPI pickers are dropdowns. Google explains them in Create an in-cell dropdown list.
How to Use the Quality KPI Scorecard
- List your KPIs in the KPI Definition sheet.
- Set your Good, Average and Poor thresholds in the Color Settings sheet.
- Enter monthly actuals and targets in the Data Input sheet.
- Pick a month in cell D3 of the Scorecard sheet and switch between MTD and YTD.
- Open the KPI Trend sheet and pick a KPI in cell C3 to see its history.
Frequently Asked Questions
What do the traffic light colors mean?
Green means the target was achieved, yellow means slightly below target and red means underperformance.
Can I change the color thresholds?
Yes. The Color Settings sheet holds the cut-offs, and the indicators follow them.
What do UTB and LTB mean?
UTB means upper the better and LTB means lower the better. Each KPI has one of these types.
Can several people update it?
Yes. It is a Google Sheets file, so team members can view and edit it at the same time.
Related Quality KPI Templates
- Quality KPI Scorecard in Excel: the same scorecard for Excel
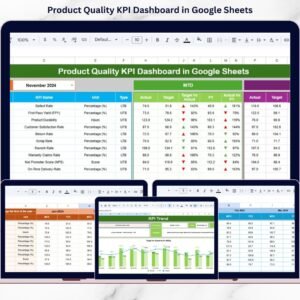
- Product Quality KPI Dashboard in Google Sheets: a dashboard view of product quality KPIs
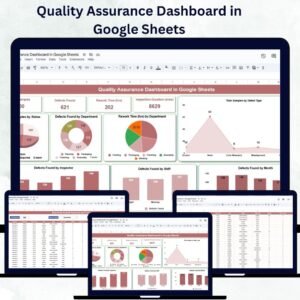
- Quality Assurance Dashboard in Google Sheets: QA results in a dashboard
- Quality KPI Dashboard in Power BI: quality KPIs in Power BI
- KPI Scorecard Mega Pack: a bundle of KPI scorecards
Browse all Google Sheets KPI Dashboards.

Reviews
There are no reviews yet.