Managing human resources efficiently requires more than just spreadsheets — it demands structured data and real-time insights. The HR Report in Excel is a ready-to-use, interactive solution that empowers HR professionals to monitor workforce metrics, analyze trends, and make smarter decisions without relying on expensive HR software.
Whether you’re tracking employee headcount, training hours, tenure, or leave trends, this Excel-based HR dashboard turns raw data into visual, actionable insights. Built with precision and flexibility, it’s ideal for HR teams, managers, and business leaders who want a complete, data-driven view of their organization’s people operations.
⚙️ Key Features of the HR Report in Excel
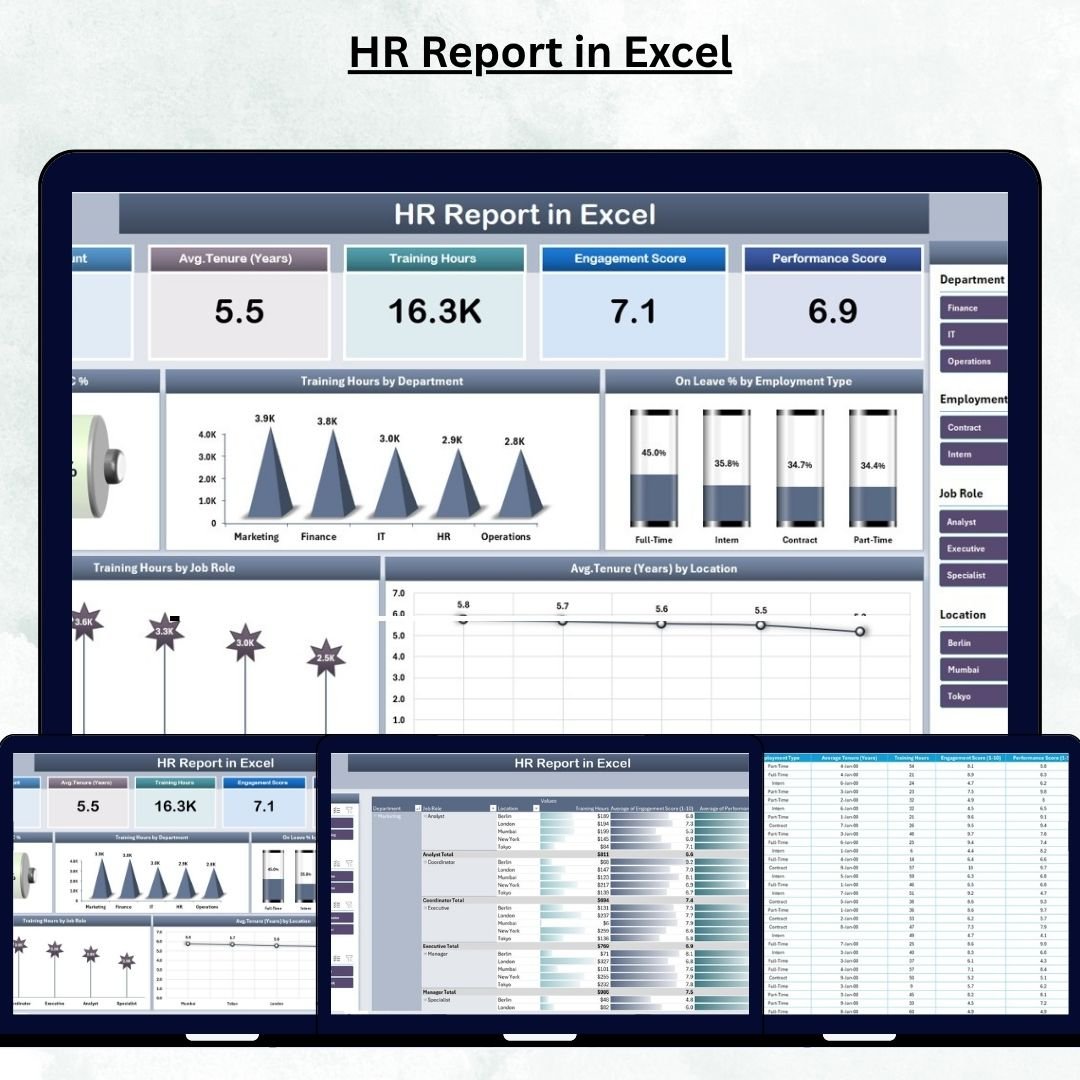
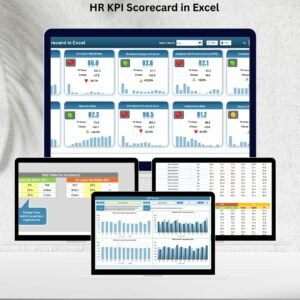
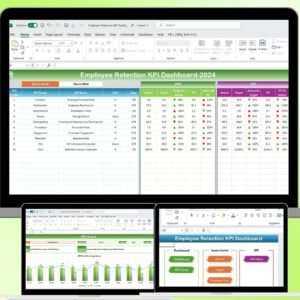
🏠 1. Summary Page – The Central HR Dashboard
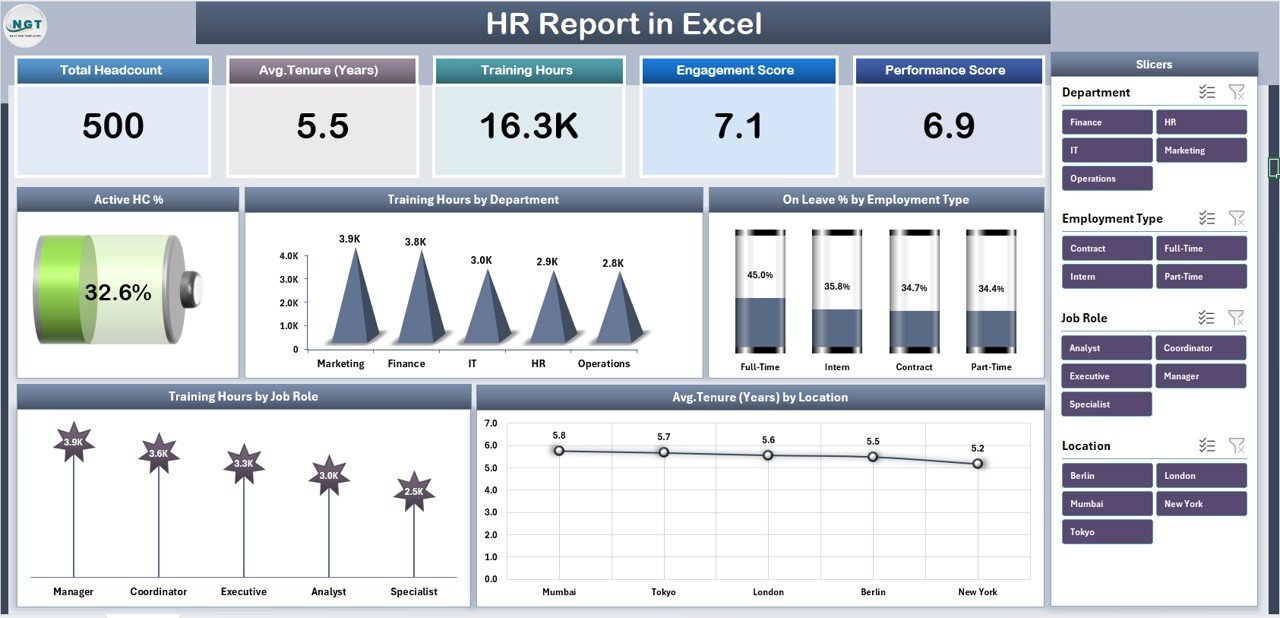
Your go-to page for instant HR insights!
Highlights:
-
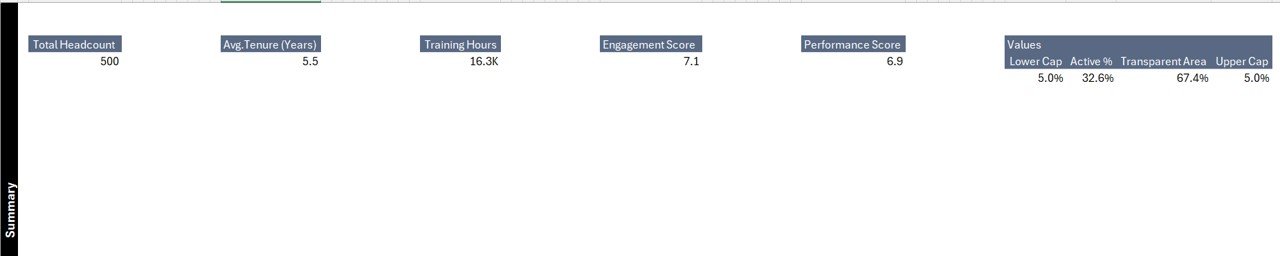
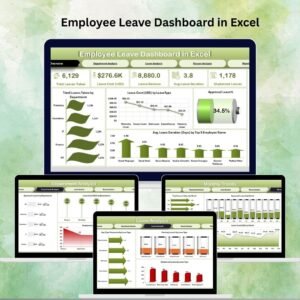
Five KPI Cards: Active Headcount %, Total Employees, Avg. Tenure (Years), Total Training Hours, and On-Leave %
-
Interactive Slicers: Instantly filter data by Department, Location, or Employee Type
-
Dynamic Charts:
-
Active HC %
-
Training Hours by Department
-
On-Leave % by Employee Type
-
Training Hours by Job Role
-
Avg. Tenure (Years) by Location
-
📊 The Summary Page gives leadership a high-level snapshot of workforce performance — perfect for meetings, audits, or performance reviews.
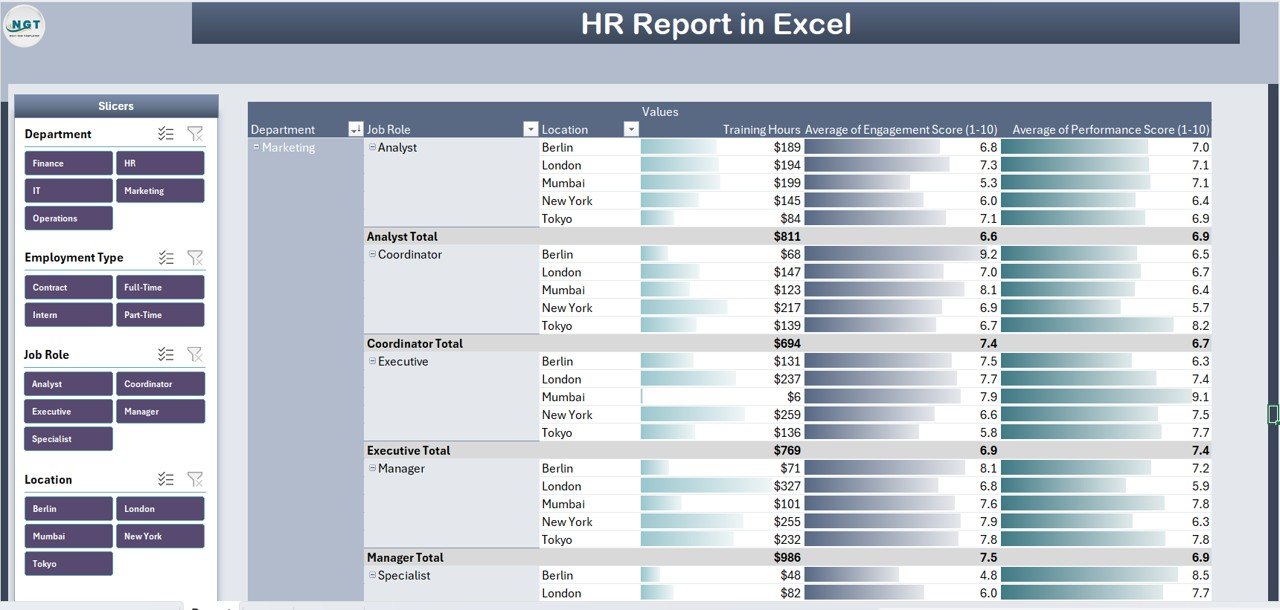
📋 2. Report Page – Dive into Detailed HR Data
Explore every metric at the employee level.
Includes:
-
Left-side slicers for Department, Designation, and Employee Type
-
Dynamic data table with:
-
Employee ID | Name | Department | Job Role | Location
-
Employment Type | Join Date | Tenure | Training Hours | Leave Days
-
🧠 Filter specific segments — for example, “Sales Executives in Delhi with >3 Years Tenure” — and instantly view the results.
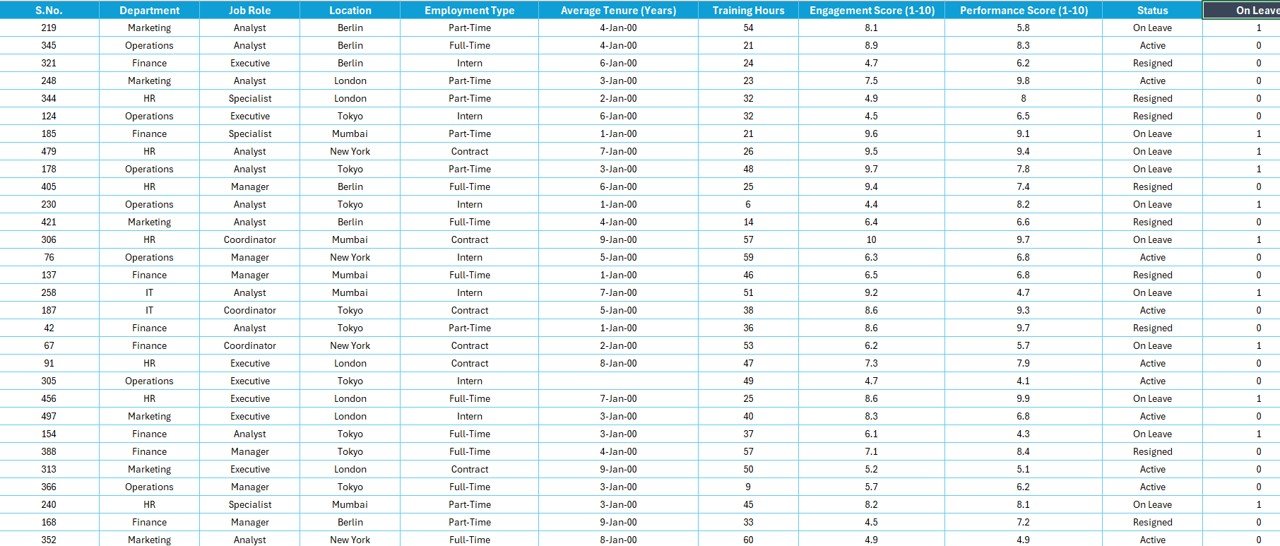
📈 3. Data Sheet – The Core HR Database
The foundation of your analytics.
Stores columns for:
Employee ID, Name, Gender, Age, Department, Designation, Location, Employment Type, Joining Date, Training Hours, Leave Days, Tenure (Years), and Status (Active / On Leave / Resigned).
✅ All charts and KPIs are powered by formulas such as SUMIFS and AVERAGEIF — making the dashboard fully automated.
⚙️ 4. Support Sheet – Behind-the-Scenes Logic
Ensures all slicers, dropdowns, and calculations work flawlessly.
Manages:
-
Department and Job Role lists
-
Lookup tables for codes and regions
-
KPI formula references
🧩 Keeps your report structured, clean, and user-friendly.
🌟 Why Use an HR Report in Excel?
💼 Centralized Data Management: Combine recruitment, training, and leave data in one file.
⚡ Real-Time Insights: Visualize workforce health instantly.
🎯 Data-Driven Decisions: Identify issues like high absenteeism or low training hours fast.
🧱 Easy Customization: Add new KPIs such as attrition rate or recruitment cost anytime.
🔒 Accuracy & Transparency: Formula-based calculations ensure reliability.
🚀 Advantages of HR Report in Excel
✅ Quick Setup: Plug in data — get instant insights.
✅ Interactive Analytics: Use slicers for dynamic filtering.
✅ Automatic Updates: Refresh data and all visuals update instantly.
✅ Professional Design: Ideal for HR reviews and presentations.
✅ Budget-Friendly: No subscriptions or complex tools required.
This Excel-powered report offers the perfect blend of simplicity, accuracy, and professionalism for HR teams of any size.
🧭 Best Practices for Effective HR Reporting
1️⃣ Keep data clean and validated to avoid errors.
2️⃣ Use pivot tables to summarize and charts to visualize metrics.
3️⃣ Highlight key areas using conditional formatting.
4️⃣ Protect formula cells to prevent accidental edits.
5️⃣ Update data monthly for fresh insights.
👩💼 Who Can Benefit from This Report
-
HR Managers – Track training and attendance metrics.
-
Executives – Review headcount and retention KPIs.
-
Finance Teams – Analyze resource allocation and labor costs.
-
Recruitment Officers – Plan hiring based on tenure trends.
-
Small Business Owners – Manage HR data without extra software.
🔗 Click here to read the Detailed blog post
📺 Visit our YouTube channel for step-by-step tutorials
👉 YouTube.com/@PKAnExcelExpert


Reviews
There are no reviews yet.