



Time is money — and how you manage it determines your success. The Time Tracking Dashboard in Excel 💼📊 is a ready-to-use performance management tool that helps teams, managers, and business owners analyze how time is being spent across projects, departments, and roles.
Whether you want to monitor billable hours, assess productivity, or identify profitability trends, this Excel-based dashboard gives you a clear, visual representation of where every hour goes — empowering you to make data-driven decisions with confidence.
⚡ Key Features of Time Tracking Dashboard in Excel
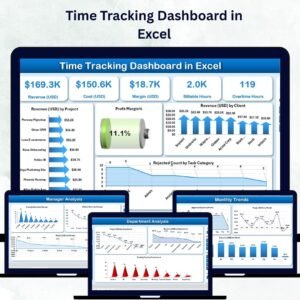
✅ Interactive Overview Page: View your most important metrics — Total Revenue, Billable Hours, Margin %, Rejected Tasks, and Productivity Rate — all in one place.
✅ Right-Side Slicer Panel: Filter your data by project, client, or month for focused analysis.
✅ Visual Insights: Explore 4 key charts — Revenue by Project, Profit Margin %, Revenue by Client, and Rejected Count by Task Category.
✅ Multi-Level Analysis: Separate analytical views for Departments, Managers, Roles, and Monthly Trends.
✅ Automated Calculations: Built-in formulas and pivot tables compute all KPIs automatically.
✅ Data-Driven Decisions: Compare MTD and YTD figures to identify strengths, weaknesses, and time inefficiencies.
✅ Fully Customizable: Add or remove KPIs, update visuals, or change color themes easily.
✅ No Coding Needed: 100% formula-based — no VBA or macros required.
✅ Cost-Effective Solution: Save time and money with a self-contained Excel dashboard that delivers professional-level analytics.
📂 What’s Inside the Time Tracking Dashboard in Excel
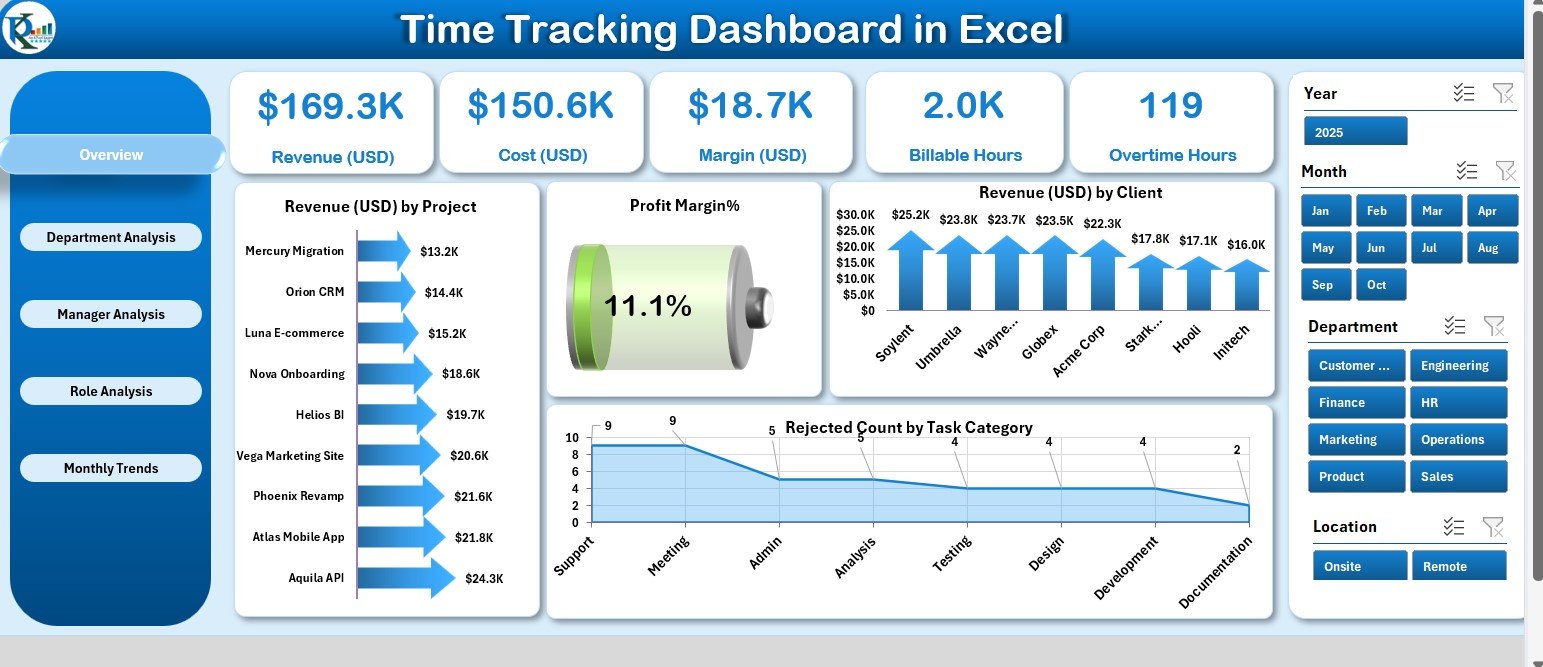
This all-in-one Excel file includes five analytical dashboard pages and supporting data sheets, working together to provide seamless performance tracking:
1️⃣ Overview Page: Your command center featuring KPIs, slicers, and visual charts for real-time insights.
2️⃣ Department Analysis Page: Compare performance across departments — margin, revenue, and pending tasks at a glance.
3️⃣ Manager Analysis Page: Track manager-level contributions using metrics like Billable Hours, Rejected Tasks, and Margin (USD).
4️⃣ Role Analysis Page: Understand role-based efficiency through KPIs such as Overtime Hours, Revenue by Role, and Pending %.
5️⃣ Monthly Trends Page: Discover time-series patterns for Revenue, Margin, and Approved Counts by Month.
📘 Supporting Sheets:
Data Sheet: The backbone of your dashboard, containing time logs, clients, and task details.
Support Sheet: Dropdown lists, slicer values, and other references that keep data consistent across the file.
Together, these components form a powerful reporting system that replaces hours of manual tracking with automated visualization.
🧠 How to Use the Time Tracking Dashboard in Excel
🪄 Step 1: Open the Excel file and go to the Data Sheet to input your hours, clients, projects, and financial data.
🎯 Step 2: Use slicers on the Overview Page to filter by project, department, or month.
📊 Step 3: Review visual KPIs for revenue, productivity, and rejected tasks.
📈 Step 4: Analyze trends in the Monthly Trends Page for long-term forecasting.
📚 Step 5: Update data weekly or monthly for continuous tracking and accuracy.
That’s it — your entire performance reporting system runs automatically, delivering instant insights every time you open the file!
👥 Who Can Benefit from This Time Tracking Dashboard
💼 Project Managers: Track billable utilization and time spent per client.
🧾 Finance Teams: Compare revenue, margin %, and cost data effortlessly.
👩💻 Department Heads: Analyze time allocation and team productivity.
📊 Consultants & Freelancers: Monitor billable vs non-billable hours to maximize profitability.
🏢 HR & Operations Managers: Identify workload imbalances and overtime trends.
📈 Business Owners: Get a 360° view of time, profit, and performance — all in one sheet.
Whether you manage a consulting firm, IT team, or creative agency, this dashboard helps you optimize every minute for measurable business growth.
🔗 Click here to read the Detailed Blog Post
🎥 Visit our YouTube channel to learn step-by-step video tutorials
👉 YouTube.com/@PKAnExcelExpert
Watch the step-by-step video tutorial:
Compatibility and Requirements
- Works in Microsoft Excel desktop (Excel 2016 or later, or Microsoft 365).
- The Overview page uses slicers to filter by project, client or month. Microsoft explains them in Use slicers to filter data.
Frequently Asked Questions
Which pages does the dashboard have?
Five analysis pages: Overview, Department Analysis, Manager Analysis, Role Analysis and Monthly Trends. Two supporting sheets hold the data: a Data sheet and a Support sheet.
Which charts are on the Overview page?
Four charts: Revenue by Project, Profit Margin %, Revenue by Client and Rejected Count by Task Category. The page also shows Total Revenue, Billable Hours, Margin %, Rejected Tasks and Productivity Rate.
How do I filter the dashboard?
Use the slicer panel on the right side of the Overview page to filter by project, client or month.
Do I need macros or VBA?
No. The dashboard is built with formulas and pivot tables, and the KPIs calculate automatically.
Can I compare month-to-date and year-to-date figures?
Yes. The dashboard compares MTD and YTD figures, and the Monthly Trends page shows Revenue, Margin and Approved Counts by month.
Is there a Google Sheets or Power BI version?
Yes. See the Time Tracking Dashboard in Google Sheets and the Time Tracking Dashboard in Power BI.
Related Time Tracking Templates
- Time Tracking Dashboard in Google Sheets: the same dashboard for Google Sheets
- Time Tracking Dashboard in Power BI: the Power BI edition
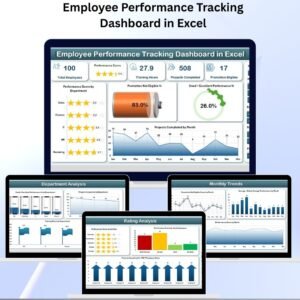
- Attendance and Overtime Dashboard in Excel: attendance and overtime views
- Advanced Employee Time Sheet in Excel: a timesheet to record hours per employee
- Project Management Pro Bundle: 9 project templates in one download
Browse all Excel dashboards.









Reviews
There are no reviews yet.