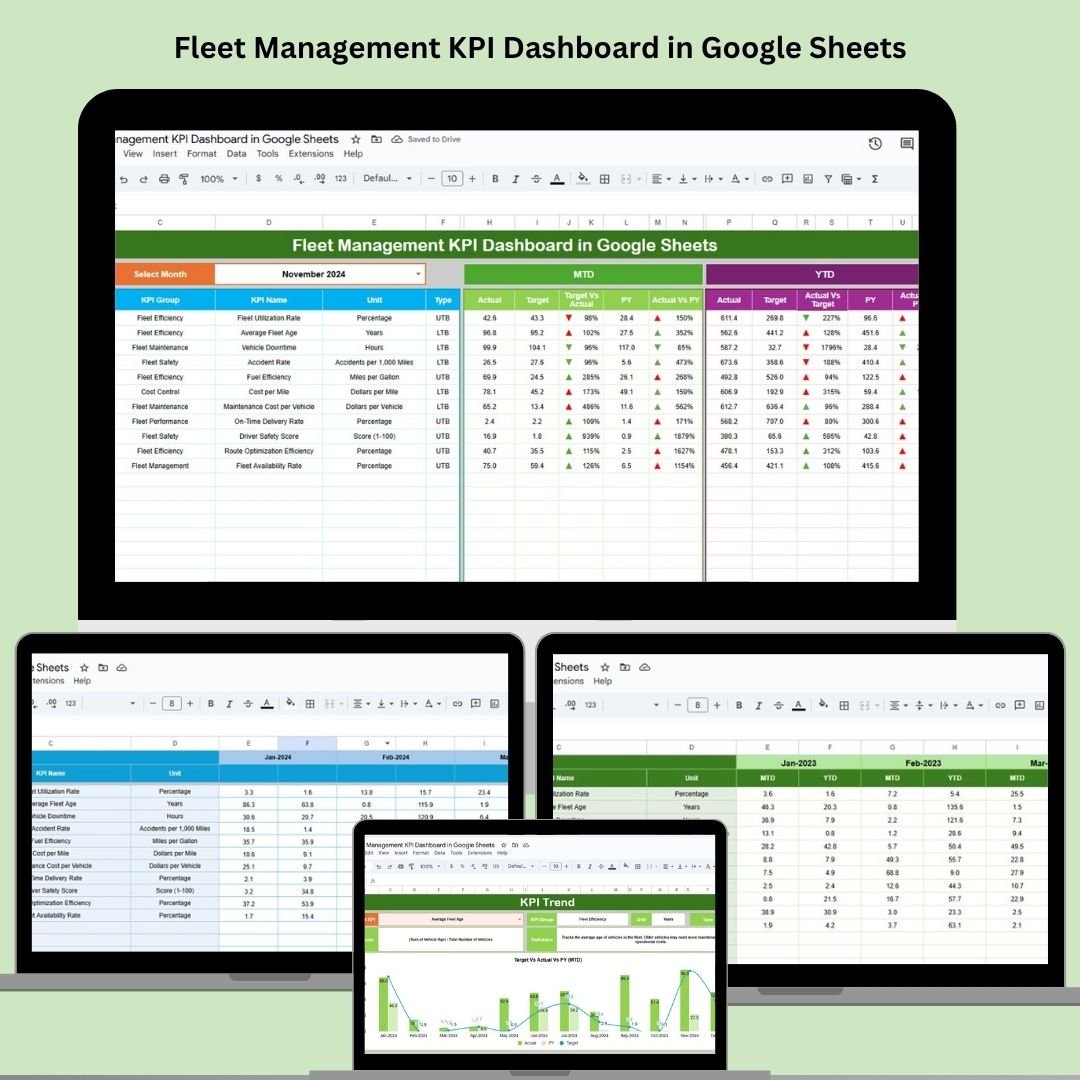
Manage your fleet operations smarter, faster, and more efficiently with the Fleet Management KPI Dashboard in Google Sheets. This fully-interactive, ready-to-use dashboard helps fleet managers and logistics teams monitor key performance indicators—fuel efficiency, vehicle utilization, maintenance costs, and more—directly from a dynamic Google Sheets interface.
Whether you operate a small delivery fleet or oversee an enterprise transportation network, this dashboard provides real-time insights to help you lower costs, boost vehicle uptime, and optimize driver performance.
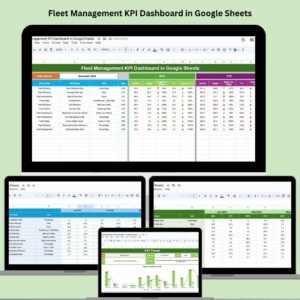
🔑 Key Features of the Dashboard
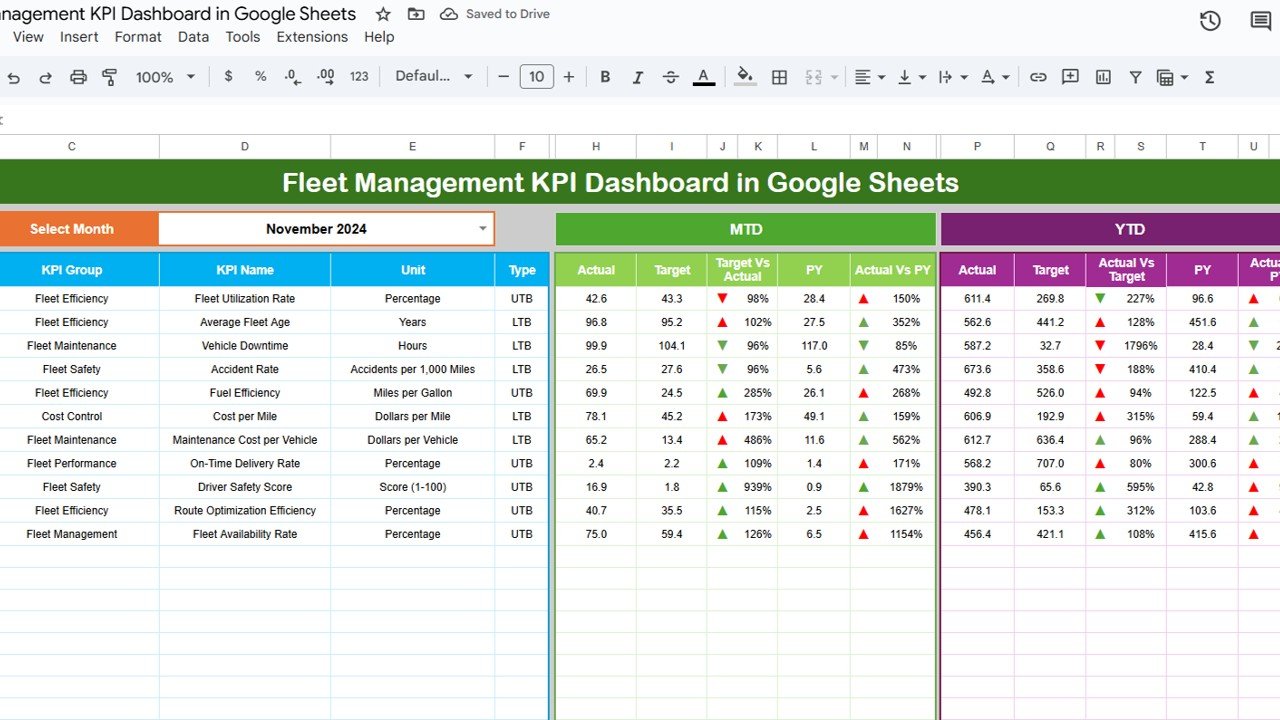
📊 Dashboard Sheet Tab
-
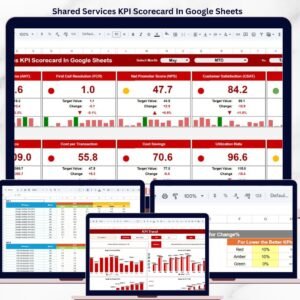
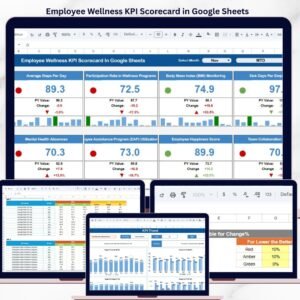
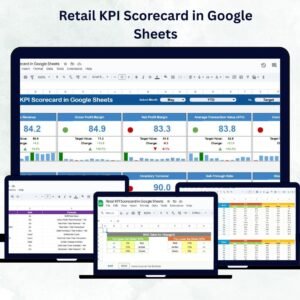
Cards for Quick KPIs: MTD Actual, Target, Previous Year, YTD, and Target vs Actual (with up/down arrows)
-
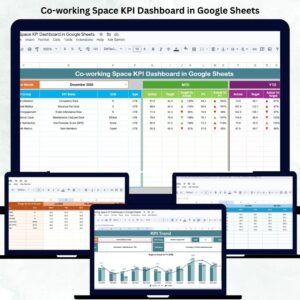
Visual Charts: Easily digest fleet data through responsive bar, pie, and column charts
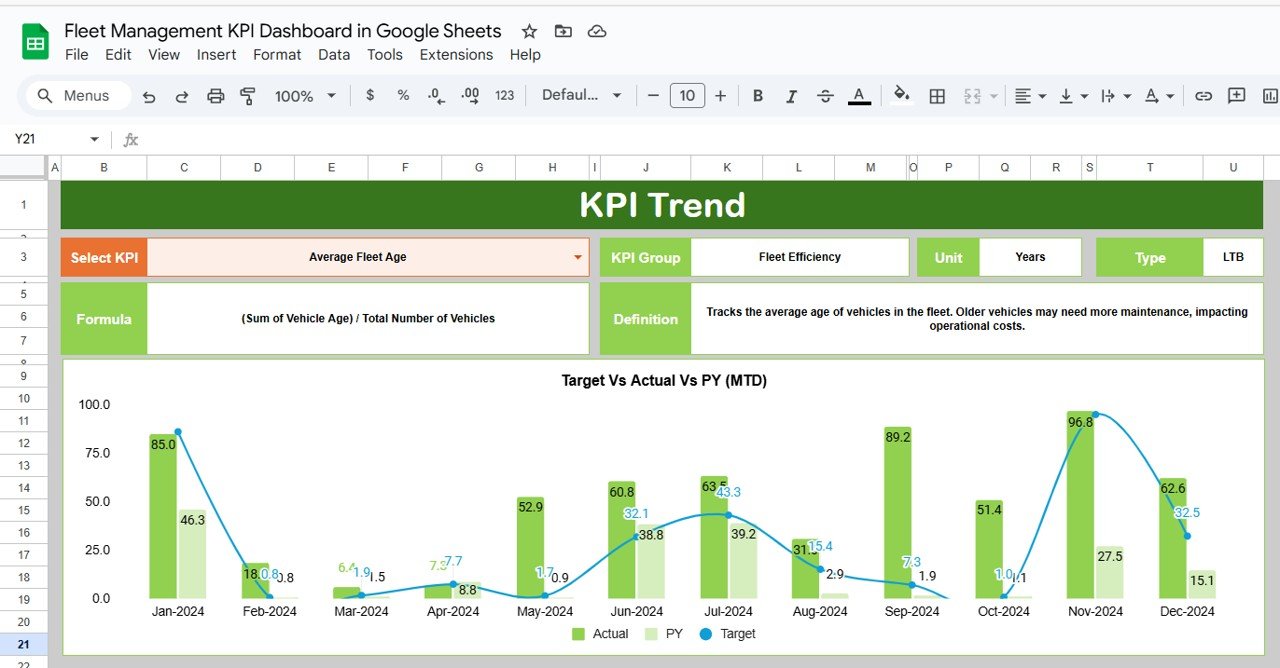
📈 KPI Trend Sheet Tab
-
Dropdown Selection: Choose any KPI to view historical trends
-
Details Shown:
-
KPI Group (e.g., Maintenance, Utilization)
-
Unit (e.g., Liters, Miles, Hours)
-
Formula
-
Type (UTB or LTB)
-
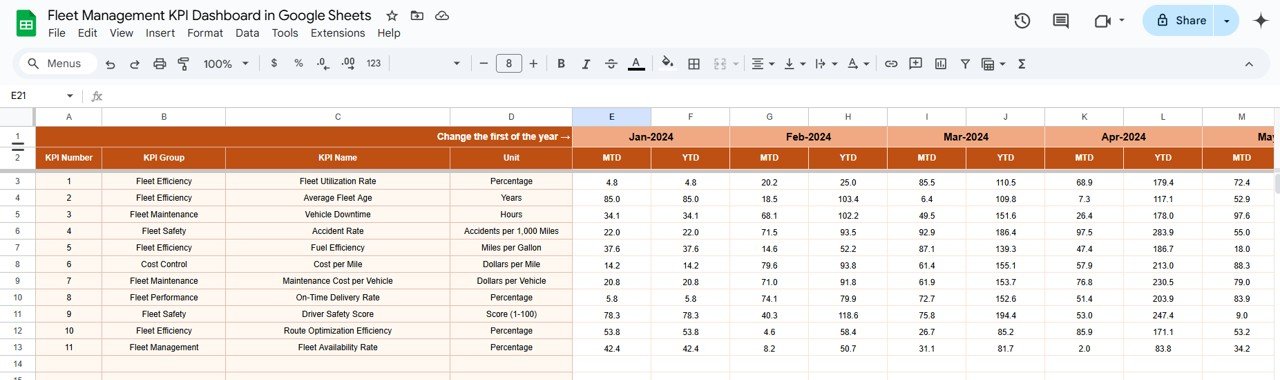
🧮 Actual Number Sheet Tab
-
Input actual fleet metrics by month
-
Auto-calculates MTD and YTD values
-
Feeds the dashboard and trend charts in real time
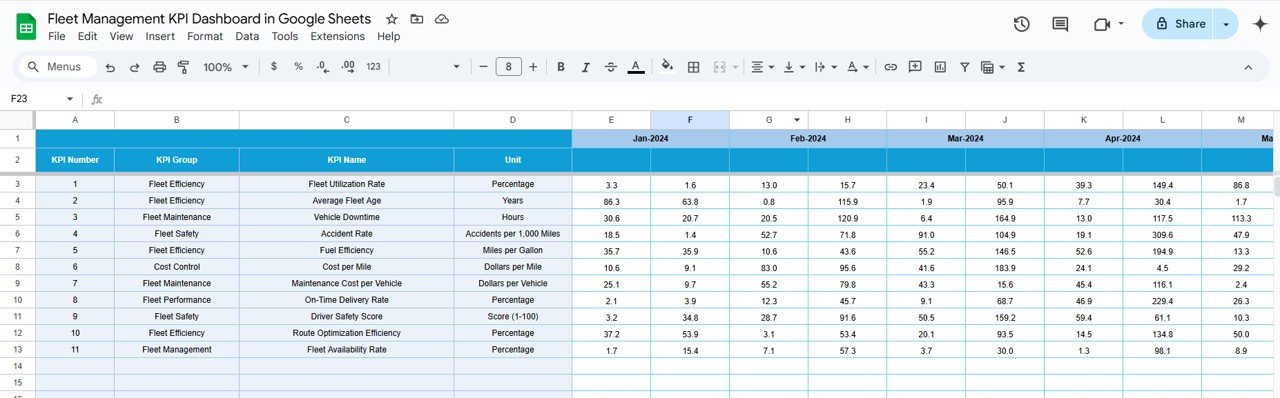
🎯 Target Sheet Tab
-
Set monthly targets for each KPI
-
Compare actual vs expected to identify underperformance early
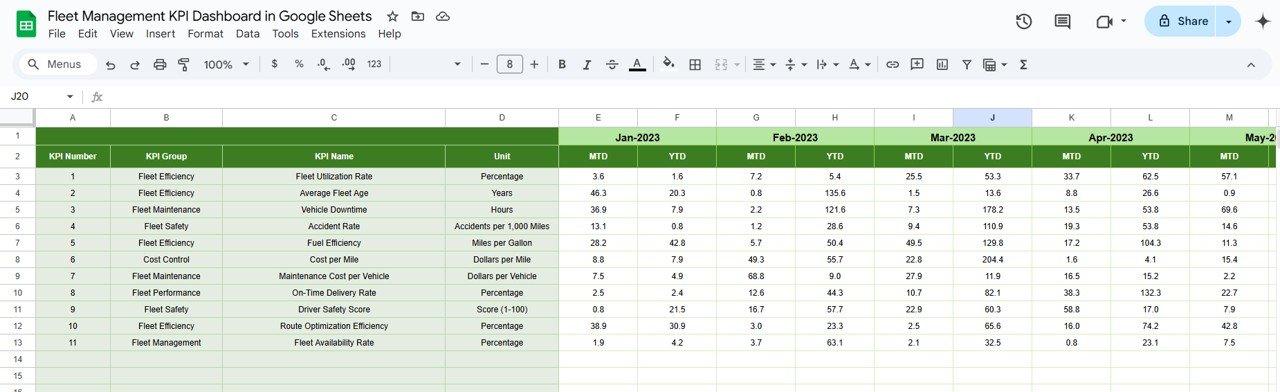
🕒 Previous Year Sheet Tab
-
Compare this year’s metrics to last year’s performance
-
Spot long-term progress or declining patterns
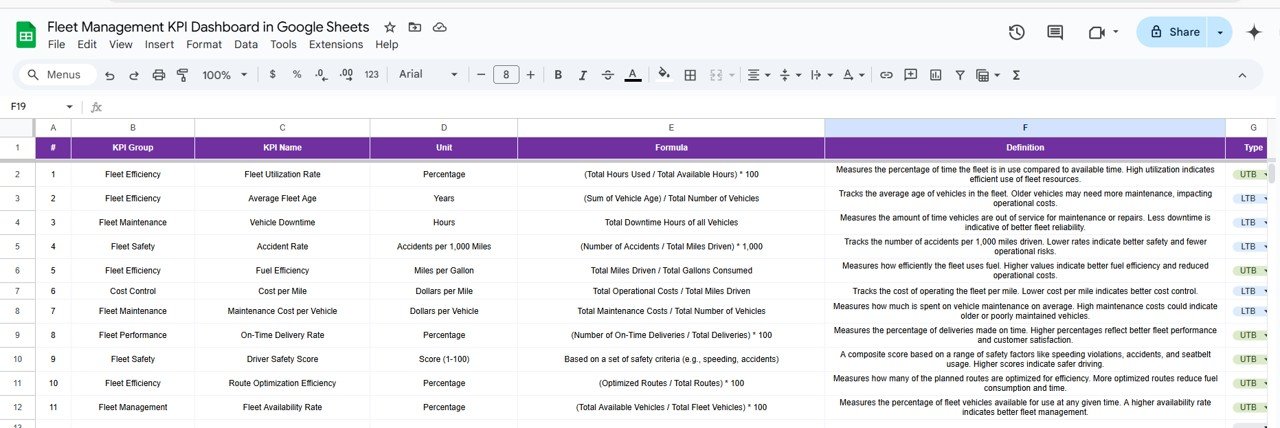
📘 KPI Definition Sheet Tab
-
Centralized definitions and formulas for all tracked KPIs
-
Quickly understand what each metric means and how it’s calculated
🛠 Sample KPIs Included
-
Fuel Consumption per Mile (Lower the Better)
-
Vehicle Downtime Hours (Lower the Better)
-
Maintenance Cost per Vehicle
-
Mileage per Gallon (Upper the Better)
-
Driver Performance Score
-
Fleet Utilization Rate %
You can easily add, remove, or rename KPIs to suit your organization’s needs.
⚙️ Use Cases
-
Optimize fuel efficiency
-
Monitor vehicle downtime
-
Improve driver accountability
-
Balance vehicle allocation by department or region
-
Benchmark monthly & yearly performance
🚀 Benefits
✅ Google Sheets-Based: No software installation required
✅ Real-Time Dashboards: Immediate feedback when you update actuals
✅ Scalable: Works for fleets of 5 or 500+
✅ Customizable: Add more KPIs, change formulas, tweak visuals
✅ Data-Driven Decisions: Track where you’re wasting fuel, losing productivity, or overspending
📘 How to Use
-
Open the Template in Google Sheets
-
Go to the Actual Number Sheet to enter your data by month
-
Set KPI Targets in the Target Sheet
-
Review Results on the Dashboard Sheet
-
Track Performance Trends in the KPI Trend Sheet
-
Compare Last Year’s Data using the Previous Year tab
-
Refer to KPI Definitions for clarity on metrics and calculations
👥 Who Is This For?
-
Fleet Managers
-
Logistics Coordinators
-
Transportation Companies
-
Vehicle Leasing Firms
-
Courier & Delivery Operations
-
Field Service Managers
Watch our tutorials:
📺 YouTube.com/@NeotechNavigators


Reviews
There are no reviews yet.