


Transform raw feedback into real results! Whether you’re managing an educational institute, online learning platform, or corporate training team, the Education and Learning Customer Feedback KPI Dashboard in Excel gives you everything you need to track, analyze, and improve learner satisfaction—all in one intuitive template.
⚙️ Key Features of the Education and Learning Customer Feedback KPI Dashboard
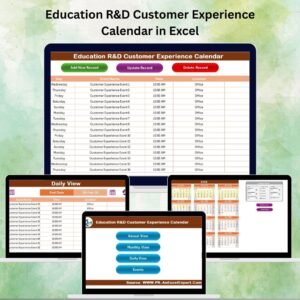
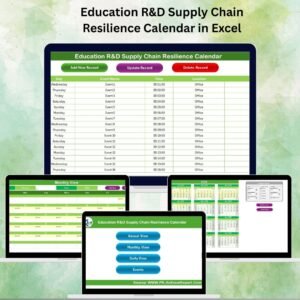
🏠 Home Sheet

Your dashboard command center with 6 quick-access buttons for instant navigation.
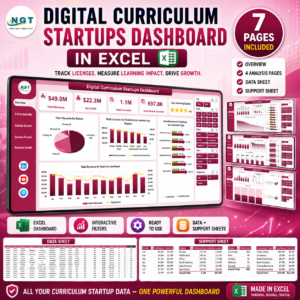
📊 Dashboard Sheet
Get a snapshot of your feedback performance:
-
📅 MTD and YTD Actuals, Targets, and Previous Year values
-
🎯 Conditional formatting with up/down arrows for performance tracking
-
📉 Charts that update when you change the selected month
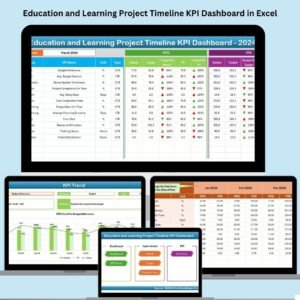
📈 KPI Trend Sheet
Drill into trends for any selected KPI:
-
📊 View KPI Group, Unit, Type (LTB or UTB), Formula, and Definition
-
📆 Trend charts for MTD and YTD with historical comparison
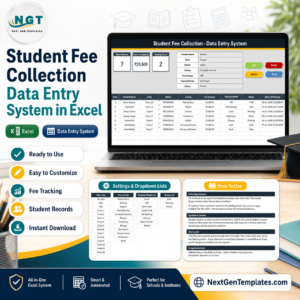
📝 Actual Numbers Input Sheet
Enter your real performance metrics:
-
📌 Choose your starting month
-
📊 Input MTD and YTD values for each KPI
🎯 Target Sheet
Plan ahead by entering monthly and yearly targets for each feedback metric.
📉 Previous Year Sheet
Add last year’s data for comparative insights and trend analysis.
📋 KPI Definition Sheet
Document all your metrics:
-
KPI Name, Group, Unit, Formula, and Description
-
Add, remove, or modify as needed
📁 What’s Inside the Dashboard?
All features are powered by clean, structured data entry and automation:
📌 MTD/YTD Tracking – Monitor month-to-date and year-to-date performance
📌 Interactive Charts – Instantly reflect changes made in input sheets
📌 Dynamic Drop-downs – Easily select months, KPIs, and indicators
📌 Custom KPI Types – Define LTB (Lower is Better) or UTB (Upper is Better)
This dashboard is easy to use—even for non-technical users—and 100% customizable.
🧠 How to Use the Customer Feedback KPI Dashboard
📥 Step 1: Download the File
Open the Excel dashboard on your desktop app for full functionality.
🧭 Step 2: Navigate via Home Sheet
Use the buttons to jump to each core section (Dashboard, Inputs, Trends, etc.).
📝 Step 3: Input KPI Data
Enter your monthly and YTD feedback results into the Actual Numbers Input sheet.
🎯 Step 4: Set Targets
Go to the Target sheet to define monthly and yearly goals.
📈 Step 5: Analyze Trends
Visit the Dashboard and KPI Trend pages to visualize your progress.
📤 Step 6: Share Reports
Download or export performance visuals for meetings, reviews, or team syncs.
🎯 Who Can Benefit from This Dashboard?
🎓 Educational Institutions – Universities, colleges, and schools
💻 E-learning Platforms – Online courses and MOOCs
🏢 Corporate L&D Teams – Internal training & feedback monitoring
📊 Training Providers – Workshop and certification managers
🚀 EdTech Startups – Track feedback metrics to improve product offerings
No matter your audience size, this dashboard scales to fit your needs.
💡 Why Choose This Excel Dashboard?
✅ Built in Microsoft Excel – No extra tools needed
✅ Beginner-Friendly – Drop-downs, slicers, and automation built-in
✅ Fully Editable – Add, remove, or customize KPIs
✅ Trend-Driven Insights – Visualize your growth or gaps
✅ Saves Time – No more manual report generation
✅ Stakeholder-Ready – Export visuals for management presentations
🔗 Click here to read the Detailed blog post


Reviews
There are no reviews yet.