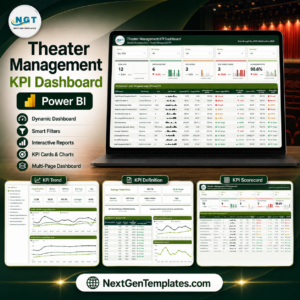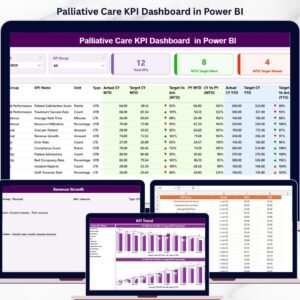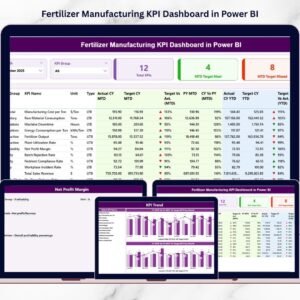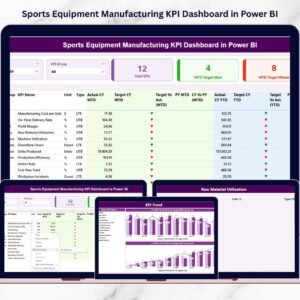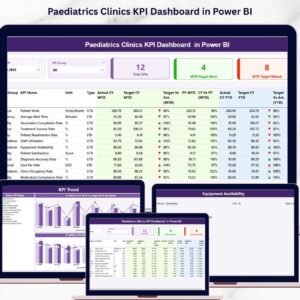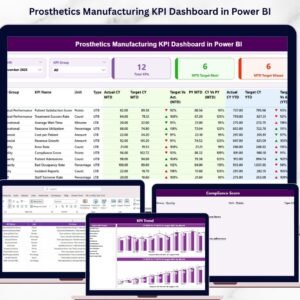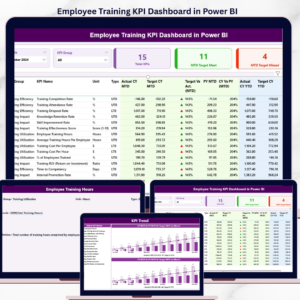
Cybersecurity is no longer just an IT concern—it’s an organization-wide priority. Measuring awareness is just as important as implementing security protocols. That’s where the Cybersecurity Awareness KPI Dashboard in Power BI comes in.
Designed for CISOs, IT leaders, and compliance teams, this dynamic dashboard tracks training progress, identifies knowledge gaps, and ensures security goals are met—all with clear visuals and real-time data.
Whether you’re running monthly phishing simulations or measuring policy adherence, this dashboard brings it all into one centralized, easy-to-use solution.
✨ Key Features of Cybersecurity Awareness KPI Dashboard in Power BI
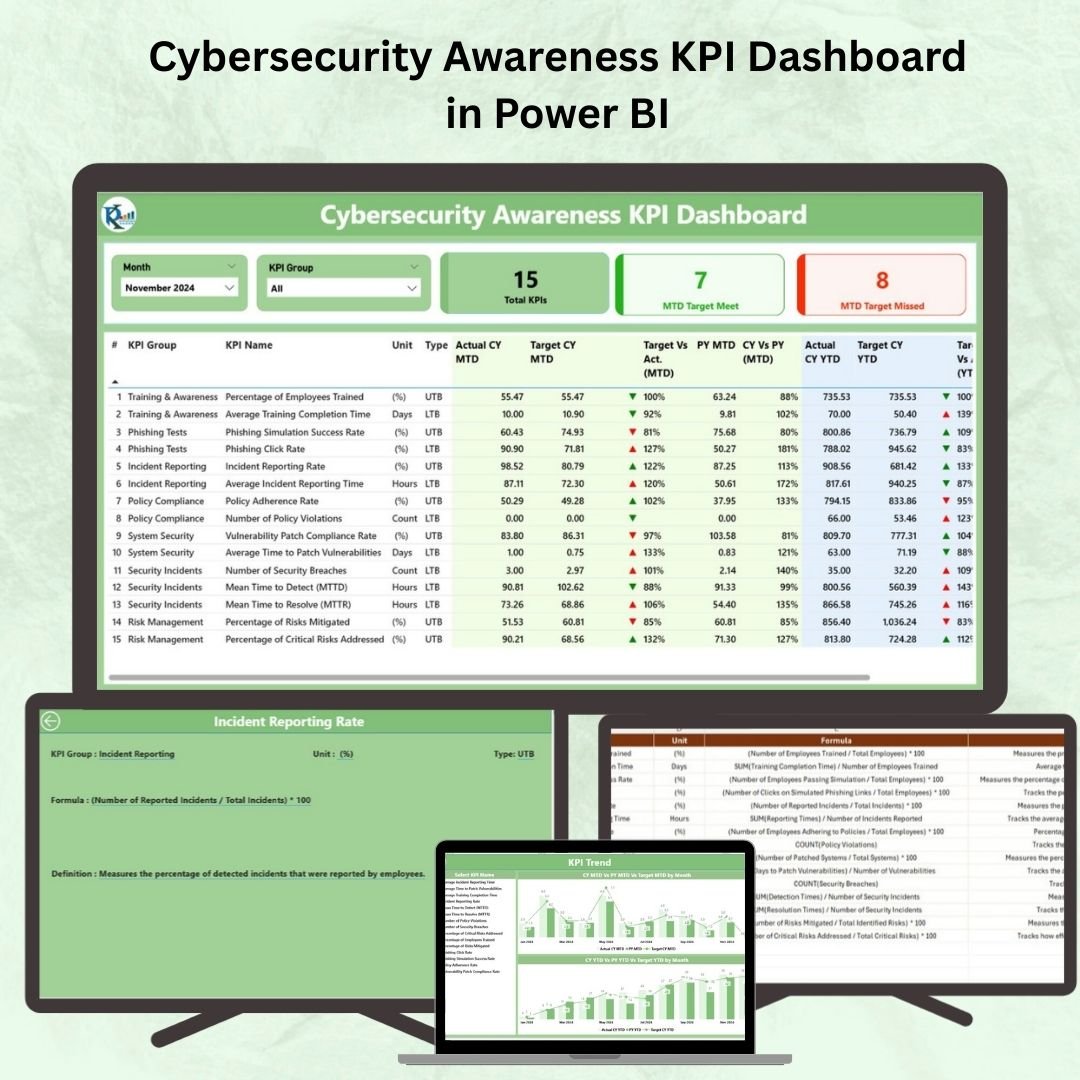
📊 Summary Dashboard
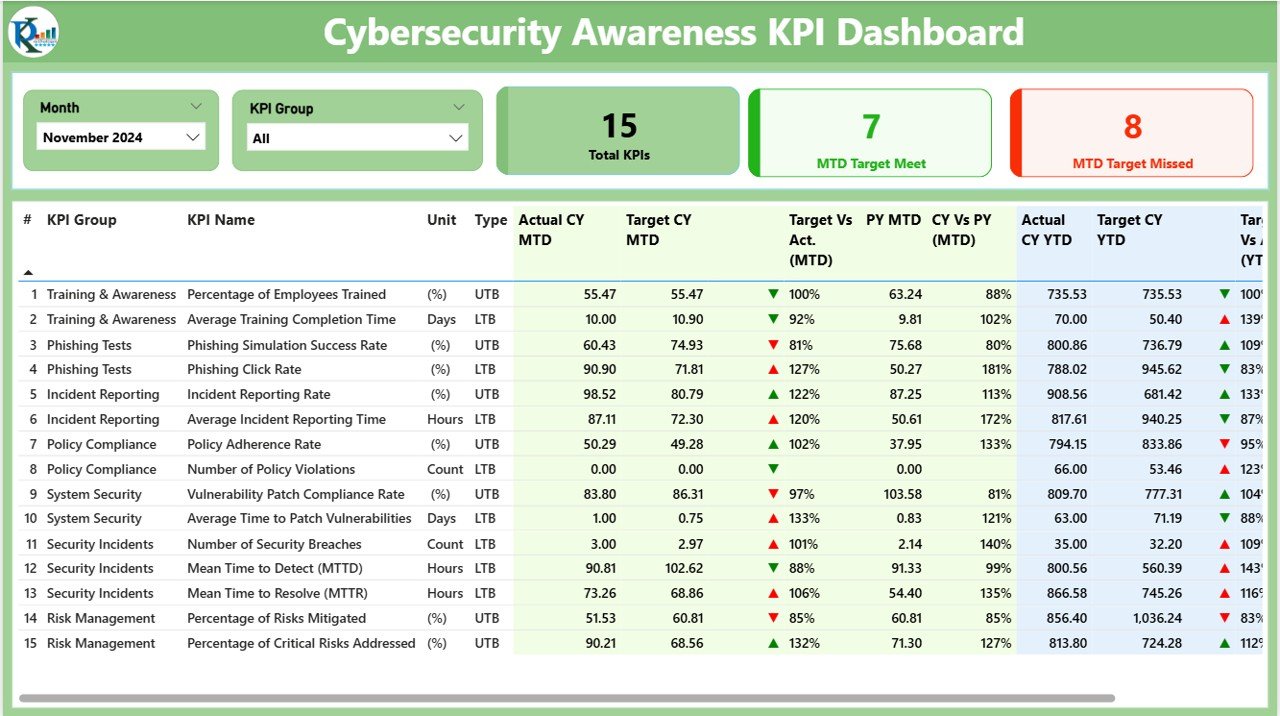
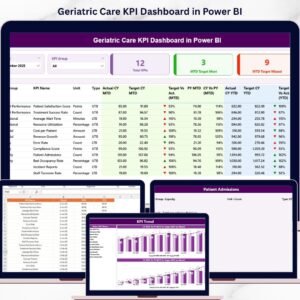
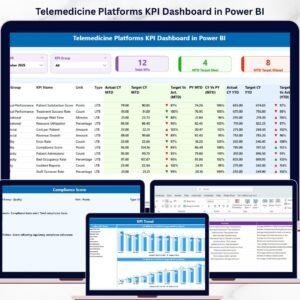
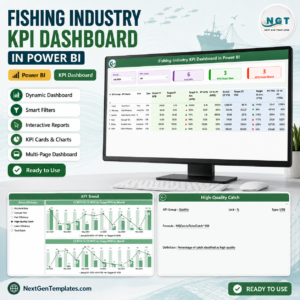
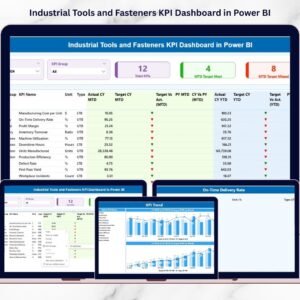
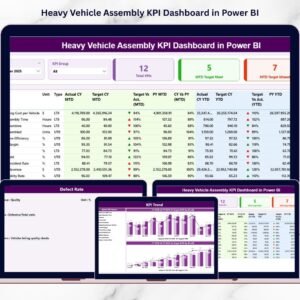
Your go-to overview for cybersecurity awareness performance. Includes:
Month & KPI Group Slicers for custom filters
KPI Cards:
✅ Total KPIs Count
🎯 MTD Target Met Count
❌ MTD Target Missed Count
Detailed KPI Table with:
KPI Name, Group, Unit, Formula
MTD & YTD Actual vs Target
% Difference from Previous Year
Visual icons (▲ for met, ▼ for missed)
Perfect for quick presentations, board updates, or performance meetings.
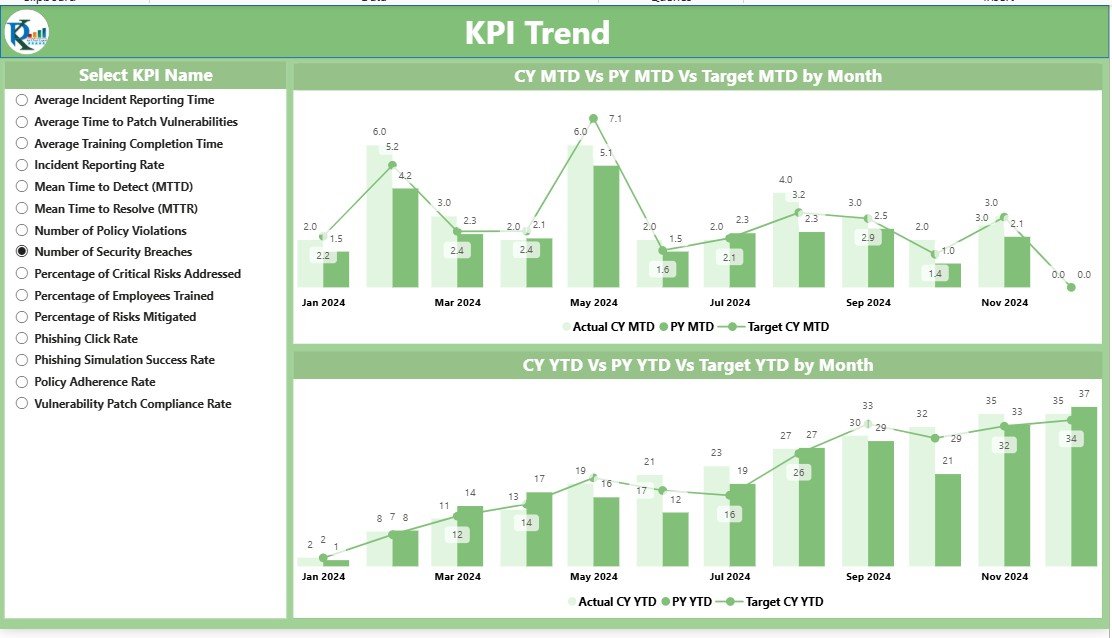
📈 KPI Trend Page – Visualize Progress Over Time
Track behavioral shifts and performance trends with two combo charts:
MTD Chart – Monthly performance vs target and last year
YTD Chart – Year-to-date improvement across metrics
KPI Slicer – Select specific KPIs for targeted insights
This page is your early warning system for awareness gaps or compliance drop-offs.
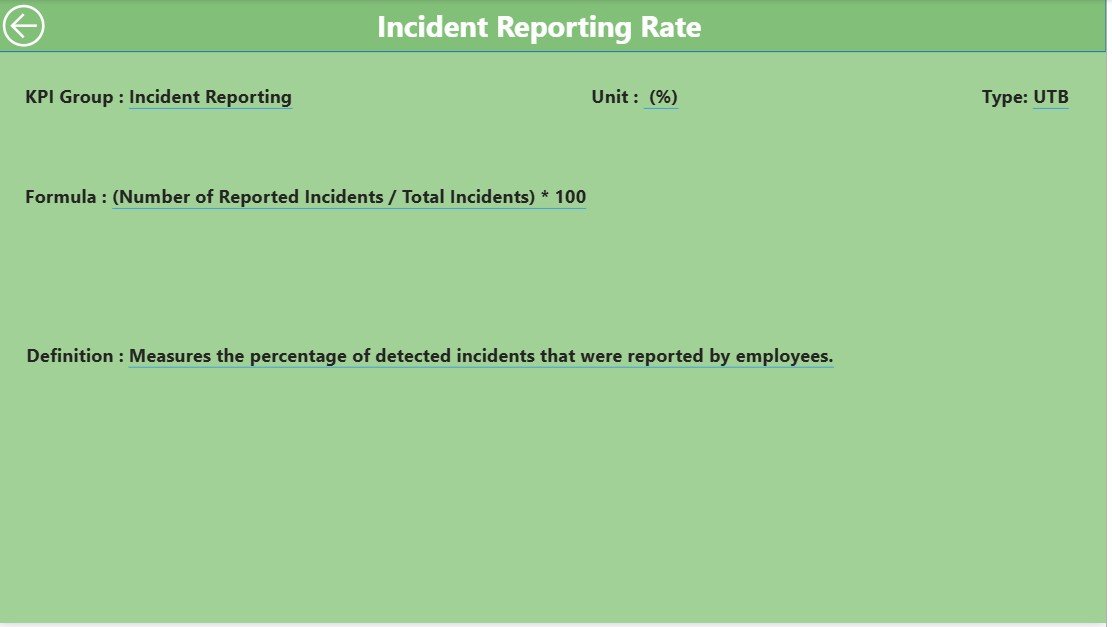
📘 KPI Definition Page (Drill-through)
Access detailed KPI metadata on demand:
KPI Formula
Description & Measurement Logic
Type (LTB – Lower the Better / UTB – Upper the Better)
Click the Back button to return to the summary page—no confusion, no lost context.
📦 What’s Included in the Power BI Dashboard?
✅ 3 Pages – Summary, Trend, and Definition Drill-through
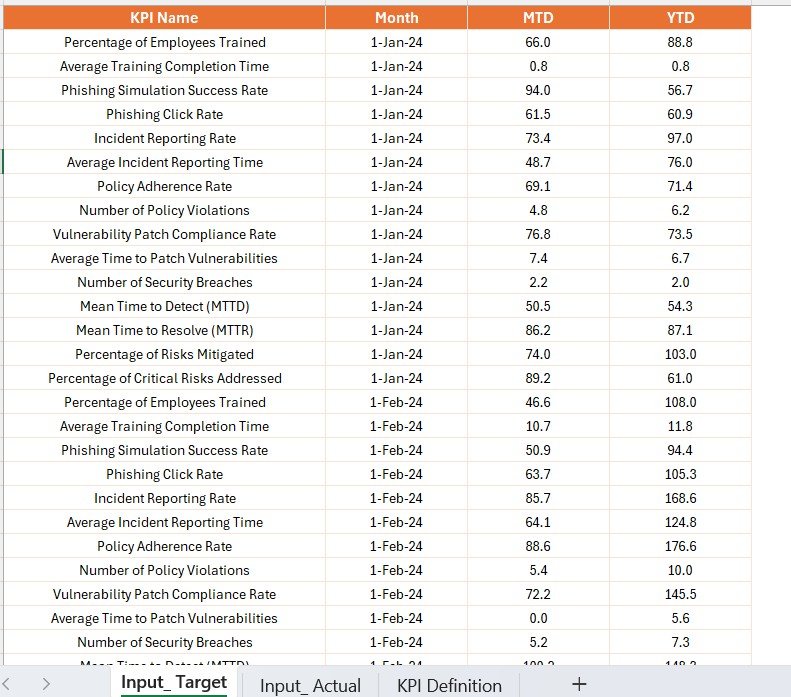
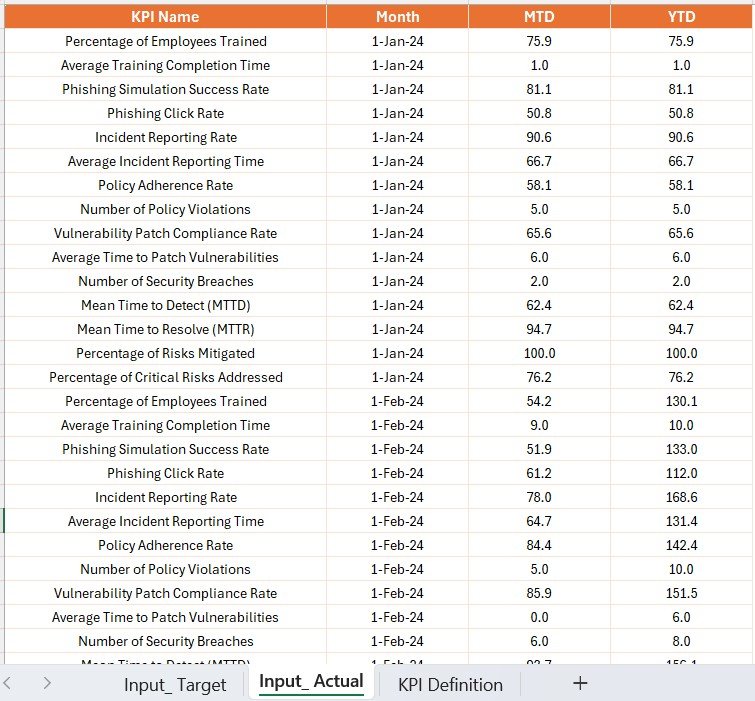
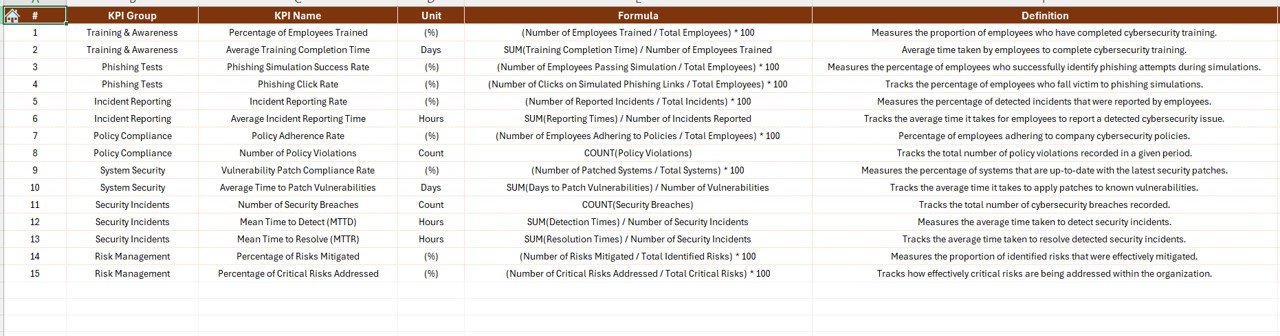
✅ Excel-based Data Source with 3 input sheets:
Actuals – Track MTD/YTD values
Targets – Set monthly goals
Definitions – Explain KPIs
✅ Combo Charts, Conditional Icons & Filters
✅ Interactive Cards & Tables
✅ User-friendly layout – No coding required
✅ Customizable color themes and KPI groups
🛠 How to Use the Cybersecurity Awareness Dashboard
Set Up Your KPIs
Populate the Excel sheets with KPI name, group, type, and formulas.Input Actuals & Targets Monthly
Fill in your MTD and YTD values for current and previous years.Open the Power BI File
Refresh the data model—everything auto-updates!Use the Dashboard
Filter by month, drill into KPI trends, and share insights with stakeholders.Review Trends & Adjust Strategy
Use visuals to analyze awareness performance and training effectiveness.
👥 Who Should Use This Power BI Dashboard?
✅ IT Security Teams – Monitor training completion, incidents, and engagement
✅ CISOs & Compliance Officers – Share awareness KPIs with leadership
✅ HR & L&D Departments – Track participation in security training
✅ Operations & Risk Managers – Align compliance with performance data
This dashboard is ideal for any organization serious about reducing human risk in cybersecurity.