

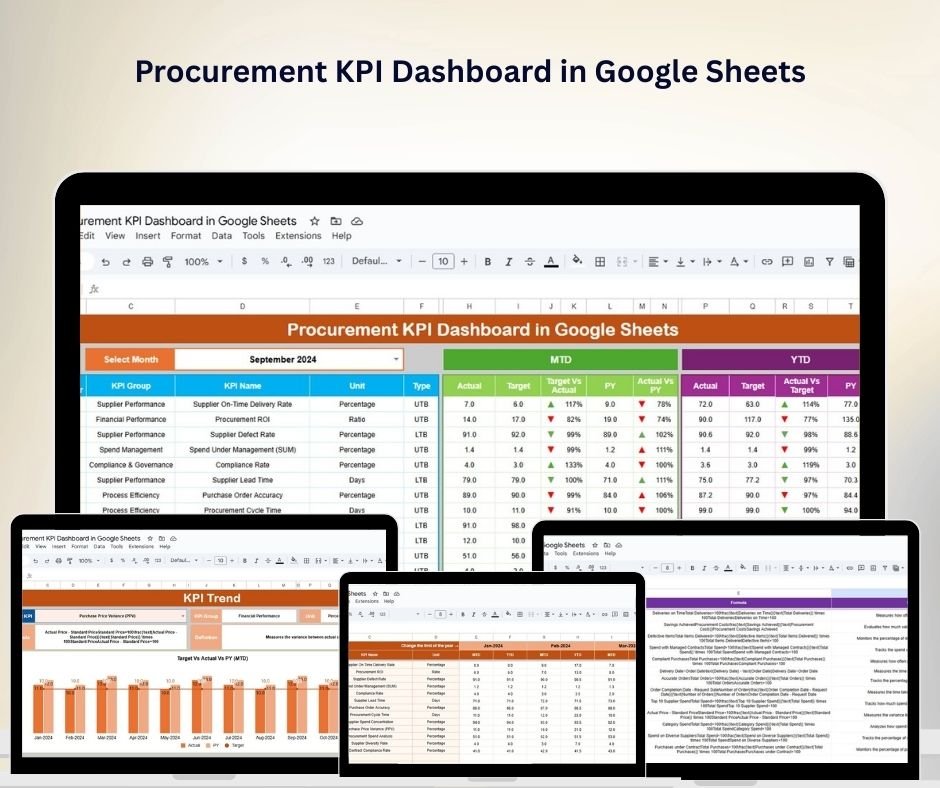
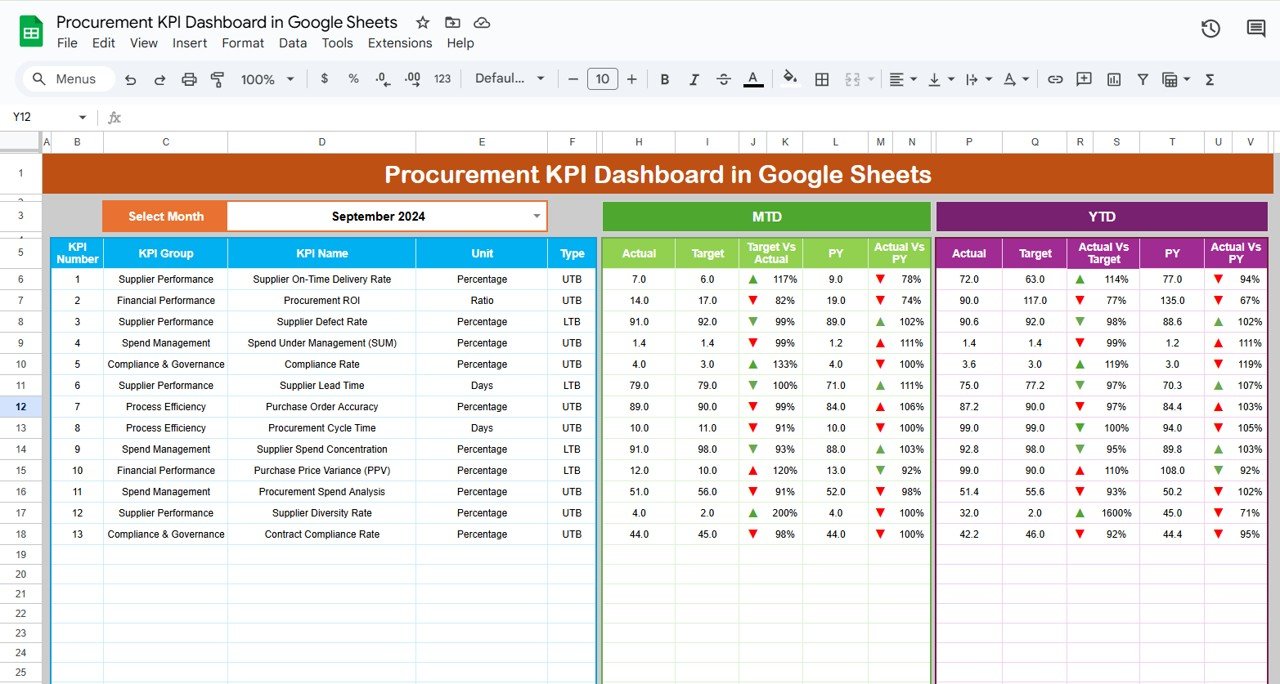
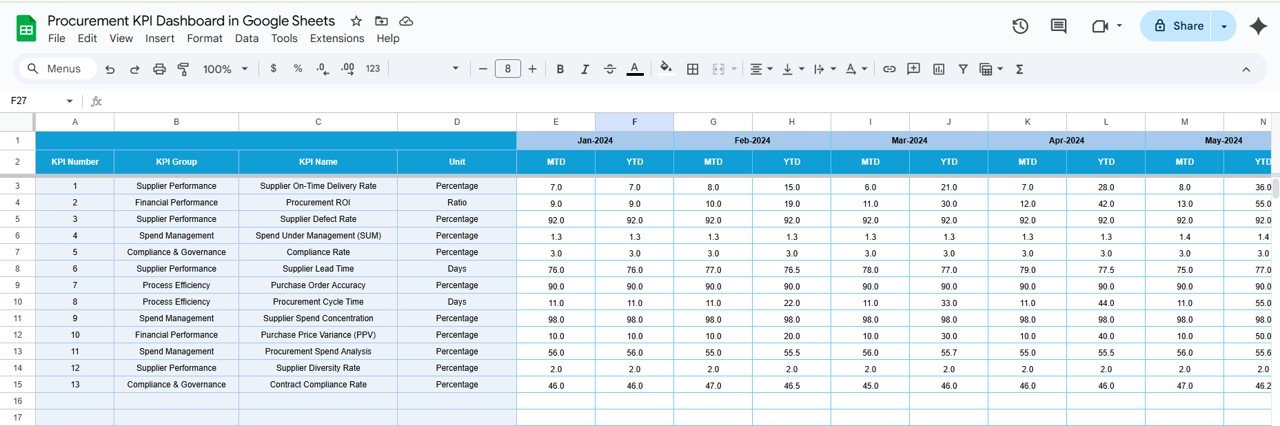
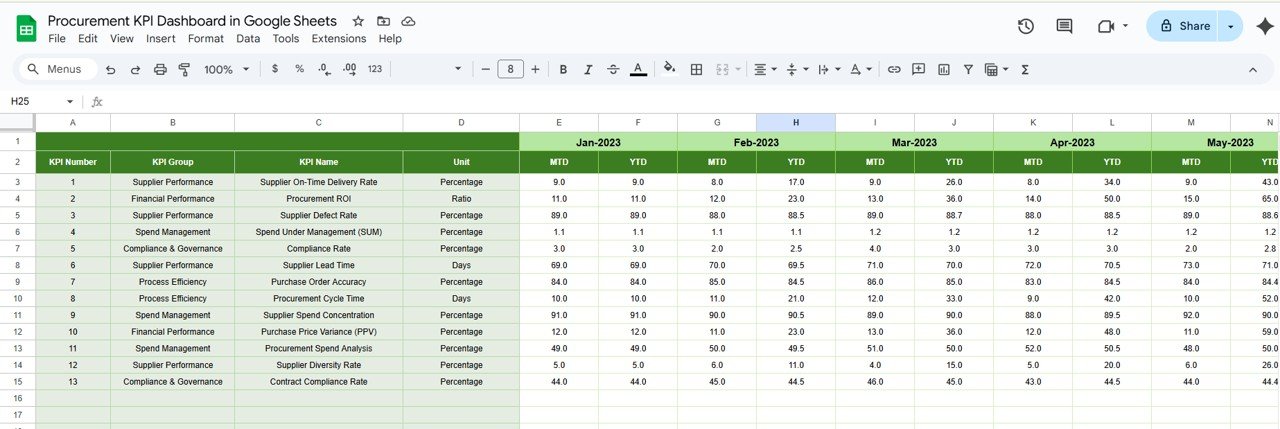
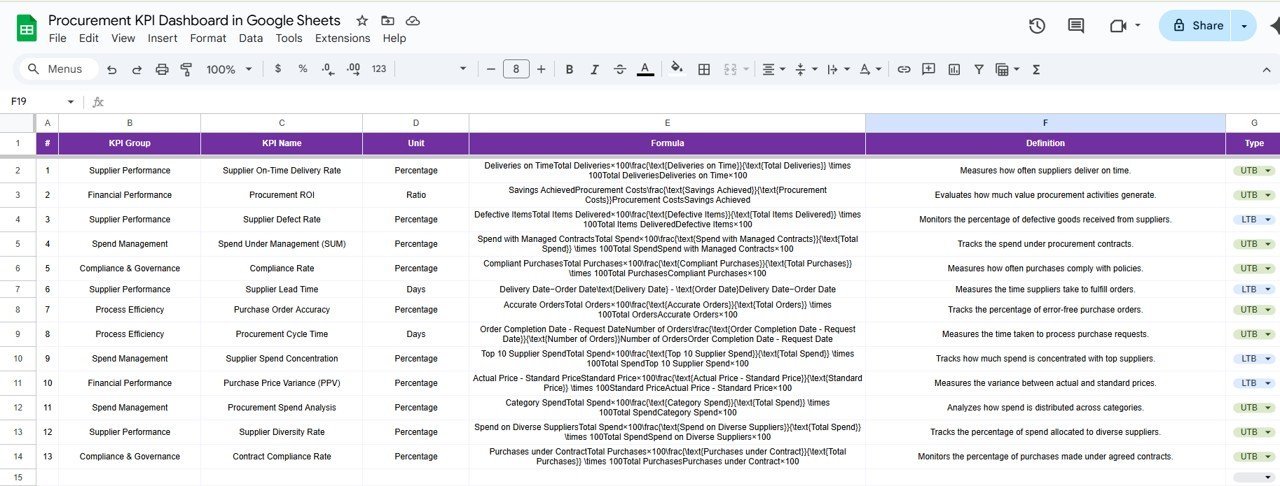

The Procurement KPI Dashboard in Google Sheets is a dynamic and essential tool designed to help procurement professionals efficiently track and analyze key performance indicators (KPIs) in their procurement activities. This dashboard provides real-time insights into procurement performance, supplier effectiveness, and cost management, enabling data-driven decisions that lead to better procurement strategies and overall business performance.
Whether you’re managing purchase orders, evaluating supplier performance, or tracking procurement costs, this dashboard ensures you stay on top of key metrics and foster stronger supplier relationships, all while identifying opportunities for cost savings and improving operational efficiency.

Key Features of the Procurement KPI Dashboard in Google Sheets
📊 Comprehensive KPI Tracking
Purchase Order Management: Monitor the status, volume, and value of purchase orders in real time to ensure timely procurement and cost-effective operations.
Supplier Performance Evaluation: Evaluate supplier reliability, delivery performance, and quality of goods to build stronger, more reliable supplier relationships.
Cost Analysis: Track and analyze procurement costs to find potential savings opportunities and optimize your procurement budget.
📈 Real-Time Data Visualization
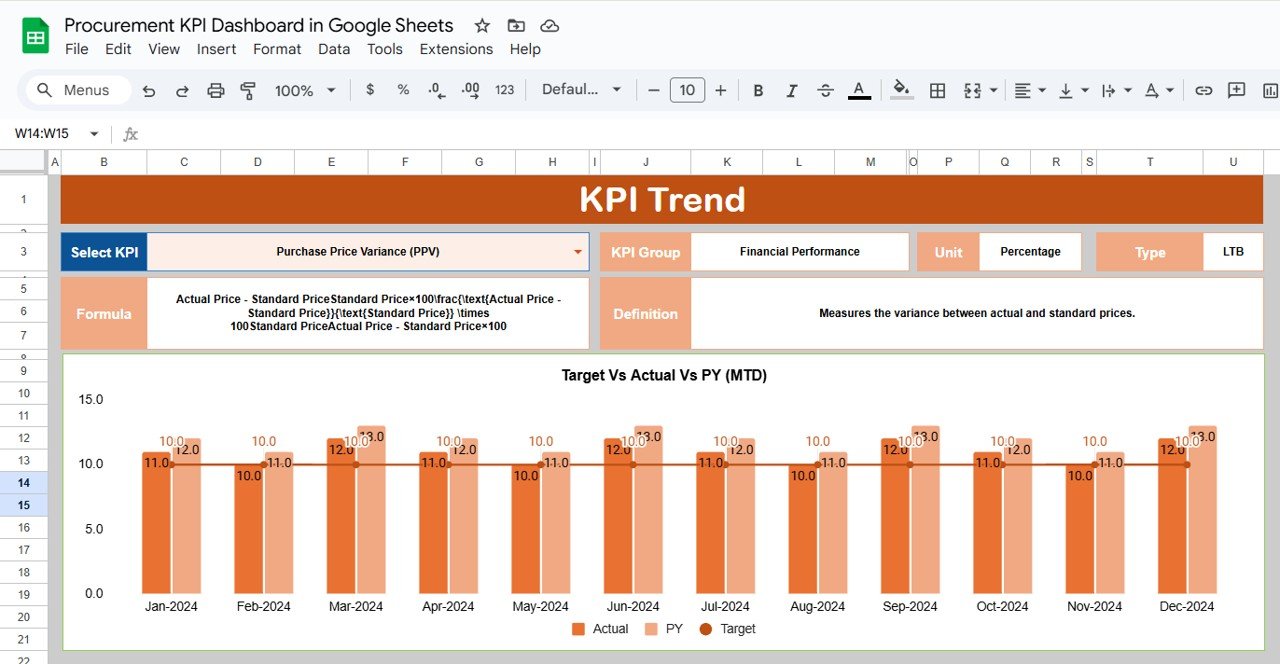
Interactive Charts and Graphs: Utilize dynamic visualizations such as bar charts, pie charts, and line graphs to represent procurement data in an engaging and easily understandable way.
Dynamic Dashboards: The dashboard updates in real time as you input data, ensuring that all information is current and actionable.
🖥 User-Friendly Interface
Intuitive Design: The dashboard features a clean and simple layout that makes it easy for users at any skill level to navigate and interpret data.
Customizable Layouts: Tailor the dashboard to focus on the KPIs that matter most to your team, department, or business goals.
🔒 Data Integrity and Security
Cloud-Based Accessibility: With Google Sheets, the dashboard can be accessed securely from any location, ensuring that your data is always available when needed.
Permission Controls: You can manage access to sensitive procurement data by setting permissions for different team members, keeping your data secure and confidential.
Benefits of Using the Procurement KPI Dashboard in Google Sheets
✅ Enhanced Decision-Making
Real-time data and visual analytics provide procurement teams with the insights they need to make informed decisions quickly and effectively.
✅ Improved Supplier Management
Monitor supplier performance consistently, ensuring that you can address issues proactively and foster long-term, reliable supplier partnerships.
✅ Cost Optimization
Track procurement expenses in detail, helping you identify areas for cost savings and optimize procurement budgets.
✅ Strategic Planning
Access comprehensive, up-to-date procurement data that supports the development of effective strategies and business growth.
Conclusion
The Procurement KPI Dashboard in Google Sheets is an invaluable tool for businesses looking to streamline their procurement operations, enhance supplier relationships, and achieve cost efficiencies. With its interactive features, real-time data updates, and customizable design, this dashboard enables data-driven decision-making that will improve procurement performance and drive business success.
Click here to read the Detailed blog post
Procurement KPI Dashboard in Google Sheets
Visit our YouTube channel to learn step-by-step video tutorials
YouTube.com/@PKAnExcelExpert
Watch the step-by-step video Demo:
How to Use the Procurement KPI Dashboard
- Open the file in Google Sheets with your Google account.
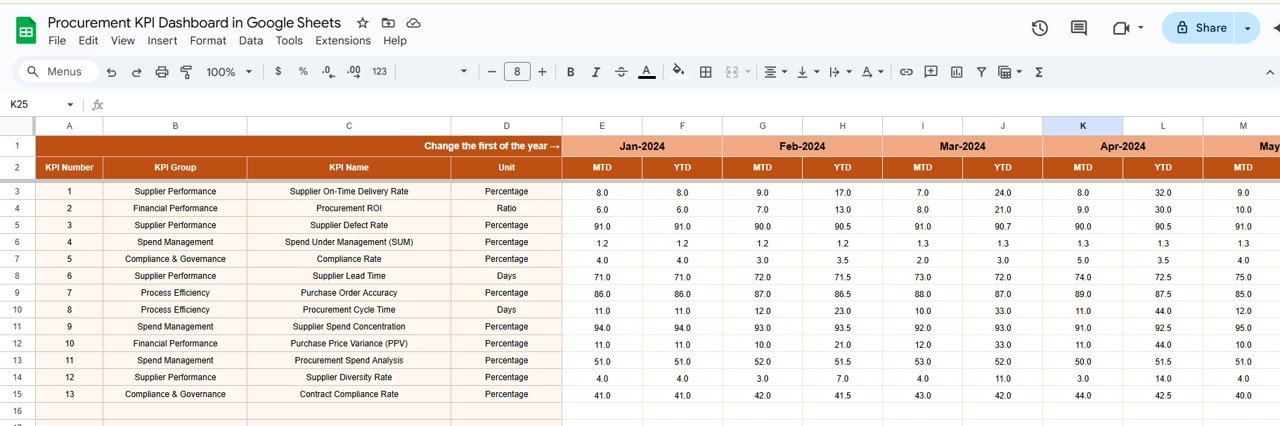
- Enter your procurement data, such as purchase orders, supplier delivery and quality results, and procurement costs.
- Check the charts and graphs, which update as you add data.
- Adjust the layout so it shows the KPIs that matter most to your team.
- Share the file and set permissions so each person sees only what they should.
Who Can Use This Dashboard
Procurement managers, purchasing teams, buyers, supply chain staff and finance teams who review purchase orders, supplier performance and spend can use it for regular procurement reporting.
Compatibility and Requirements
- Runs in Google Sheets with a free Google account and a web browser.
- Nothing to install. You open the file in Google Sheets and work in your browser.
- The dashboard is built with Google Sheets charts. Google explains them in Add & edit a chart or graph.
Frequently Asked Questions
What does the Procurement KPI Dashboard track?
Purchase order status, volume and value, supplier reliability, delivery performance and quality of goods, and procurement costs.
Which charts does it use?
Bar charts, pie charts and line graphs that update as you enter data.
Can I control who sees the data?
Yes. Because it runs in Google Sheets, you can set sharing permissions for different users.
Can I change which KPIs are shown?
Yes. You can adjust the layout to focus on the KPIs that matter to your team or department.
Related Procurement Templates
- Procurement KPI Dashboard in Excel: the same topic in Excel
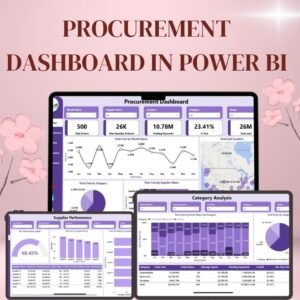
- Procurement Dashboard in Power BI: procurement reporting in Power BI
- Procurement Tracker and Dashboard in Google Sheets: log purchases and see them on a dashboard
- Purchase Order Tracker in Google Sheets: track each purchase order
- Procurement and Vendor Management Kit: a bundle of 7 procurement templates
Browse all Google Sheets KPI dashboards or the Google Sheets dashboards.











Reviews
There are no reviews yet.