



The Customer Experience KPI Dashboard in Power BI is an invaluable tool for businesses aiming to enhance customer satisfaction, improve retention, and optimize their overall customer experience. This Power BI dashboard helps organizations track and visualize critical KPIs such as customer satisfaction scores, Net Promoter Score (NPS), customer retention rates, and customer feedback to make data-driven decisions that directly impact customer loyalty.
With real-time data integration and powerful visualizations, this dashboard allows businesses to gain insights into customer sentiment, behavior, and feedback. It helps identify pain points, track service quality, and ensure that every customer interaction is aligned with your brand’s values and expectations. Whether you’re in retail, service industries, or e-commerce, this dashboard provides the metrics you need to keep your customers happy and engaged.
Key Features of the Customer Experience KPI Dashboard in Power BI
📊 Comprehensive KPI Tracking
Monitor key metrics that directly impact the customer experience, such as NPS, Customer Satisfaction (CSAT), and Customer Effort Score (CES). Easily track how customers feel about your products and services in real time.
📈 Customer Feedback Analysis
Capture and analyze customer feedback to identify trends and areas for improvement. Visualize positive and negative sentiment to understand your customer’s perspective.
📅 Retention & Loyalty Metrics
Track customer retention rates, repeat purchase frequency, and lifetime value to understand customer loyalty. This feature helps in identifying loyal customers and pinpointing opportunities for retention strategies.
💡 Service Quality Insights
Evaluate the quality of customer service and interactions by monitoring metrics such as response time, resolution time, and first contact resolution (FCR). Improve service delivery by tracking the effectiveness of your customer support teams.
⚙️ Real-Time Data Integration
Integrate your data from multiple sources such as CRM systems, support tickets, surveys, and other customer experience platforms. Keep the data updated in real time to track customer sentiment and performance.
🔑 Customizable Dashboards
Customize the dashboard to reflect your specific customer experience goals. Add or modify KPIs, adjust visualizations, and set up alerts that match your business objectives.
Why You’ll Love the Customer Experience KPI Dashboard in Power BI

✅ Comprehensive Customer Insights
Get a 360-degree view of your customer experience by tracking key performance indicators such as satisfaction scores, retention rates, and customer feedback.
✅ Real-Time Tracking & Analysis
Monitor customer sentiment and service quality in real time. Stay ahead of potential issues with proactive tracking and immediate insights.
✅ Improve Customer Satisfaction & Loyalty
Use the dashboard to identify areas where customer experience can be improved. Tailor your strategies based on data-driven insights to enhance satisfaction and loyalty.
✅ Increase Operational Efficiency
By tracking service metrics like response time and first contact resolution, you can optimize customer support workflows, reduce inefficiencies, and improve team performance.
✅ Customizable for Your Business Needs
Whether you run a retail operation, offer professional services, or operate in the e-commerce space, this dashboard can be tailored to suit your specific customer experience goals and KPIs.
What’s Inside the Customer Experience KPI Dashboard in Power BI?
Comprehensive KPI Tracking: Track NPS, CSAT, CES, and other customer satisfaction metrics.
Customer Feedback Analysis: Analyze customer feedback and sentiment for actionable insights.
Retention & Loyalty Metrics: Monitor customer retention rates, repeat purchases, and lifetime value.
Service Quality Insights: Track metrics like response time, resolution time, and first contact resolution.
Real-Time Data Integration: Integrate data from various customer experience platforms.
Customizable Dashboard: Tailor the dashboard to fit your customer experience objectives.
How to Use the Customer Experience KPI Dashboard in Power BI
1️⃣ Download the Template: Access the Customer Experience KPI Dashboard in Power BI instantly.
2️⃣ Integrate Data Sources: Connect your CRM systems, survey tools, and customer feedback platforms for real-time updates.
3️⃣ Track Key Metrics: Monitor KPIs like NPS, CSAT, and customer retention rates to measure customer satisfaction.
4️⃣ Analyze Trends & Insights: Use the feedback analysis and service quality insights to identify improvement areas.
5️⃣ Optimize Customer Experience: Use the data from the dashboard to refine your customer service, enhance satisfaction, and improve customer retention.
Who Can Benefit from the Customer Experience KPI Dashboard in Power BI?
🔹 Customer Experience Managers
🔹 Marketing Teams & Customer Success Managers
🔹 E-commerce & Retail Businesses
🔹 Service Industry Professionals
🔹 Data Analysts & Business Intelligence Professionals
🔹 Business Executives Looking to Enhance Customer Loyalty
🔹 Call Centers & Customer Support Teams
Transform your customer experience strategy with the Customer Experience KPI Dashboard in Power BI. Track satisfaction, retention, and service quality to drive positive customer outcomes and create loyal brand advocates.
Click here to read the Detailed blog post
Visit our YouTube channel to learn step-by-step video tutorials
Youtube.com/@PKAnExcelExpert
Compatibility and Requirements
- Opens in Power BI Desktop, which is free from Microsoft. See Get Power BI Desktop.
- Connect your CRM, survey and support ticket data, then refresh to update the KPIs.
Frequently Asked Questions
Which customer experience KPIs does it track?
It tracks Net Promoter Score (NPS), customer satisfaction (CSAT), customer effort score (CES), retention rate, repeat purchases and lifetime value.
Does it cover support service quality?
Yes. It shows response time, resolution time and first contact resolution (FCR) for your support team.
Can I add my own KPIs?
Yes. You can add or change KPIs and adjust the visuals to match your customer experience goals.
Where does the data come from?
You connect your own sources, such as CRM systems, survey tools, support tickets and feedback platforms.
Related Customer Experience Templates
- Customer Experience KPI Dashboard in Excel: the Excel edition
- Customer Experience KPI Dashboard in Google Sheets: the Google Sheets edition
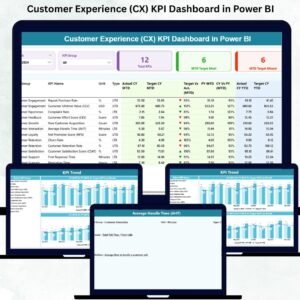
- Customer Experience (CX) KPI Dashboard in Power BI: another CX KPI layout in Power BI
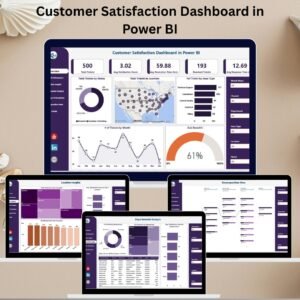
- Customer Satisfaction Dashboard in Power BI: ticket and satisfaction analysis
- Power BI Dashboard Mega Collection: 15 premium Power BI templates in one bundle
Browse all Power BI KPI dashboards or the Power BI templates.


























Reviews
There are no reviews yet.