
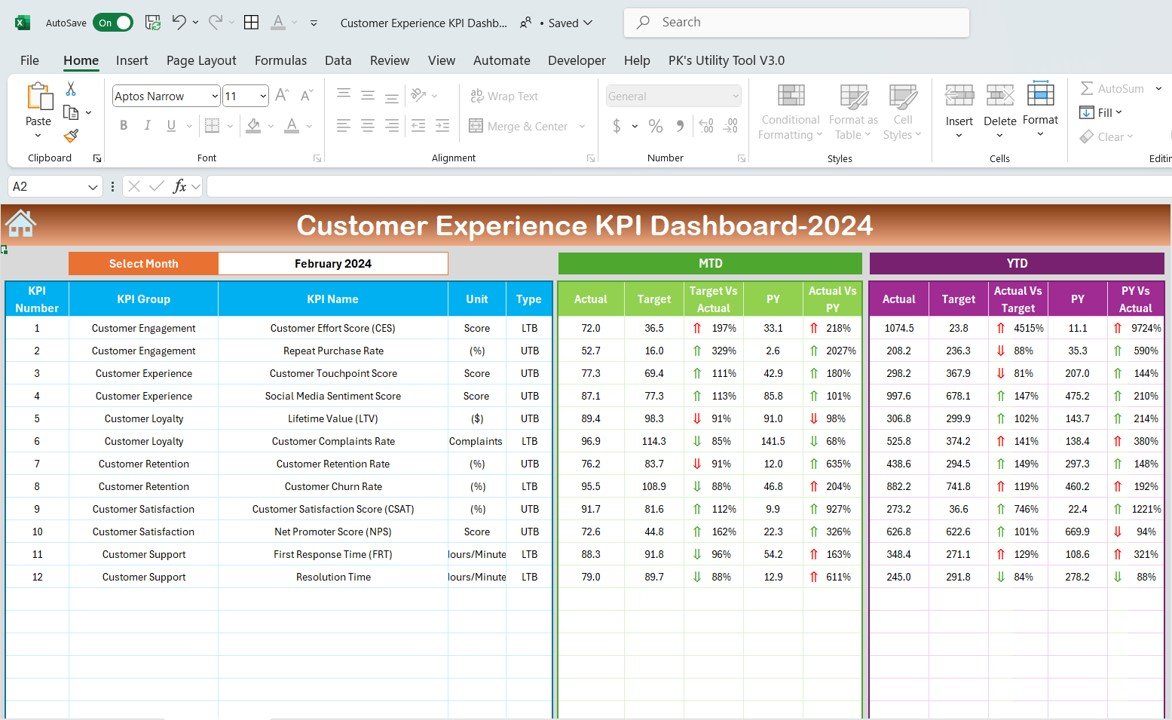

The Customer Experience KPI Dashboard in Excel is an essential tool for businesses seeking to measure and optimize their customer experience (CX). This comprehensive, customizable dashboard helps track key performance indicators (KPIs) such as customer satisfaction, Net Promoter Score (NPS), customer retention rates, and customer service response times. By providing real-time insights into how your customers perceive your brand, this tool allows you to make data-driven decisions to improve your customer service, enhance satisfaction, and build long-lasting relationships.
Whether you’re a business owner, customer service manager, or CX professional, the Customer Experience KPI Dashboard in Excel enables you to stay on top of your customer service performance. The dashboard allows you to monitor important metrics, assess the effectiveness of your CX strategy, and make necessary adjustments to ensure a positive and consistent customer experience.
Key Features of the Customer Experience KPI Dashboard in Excel
📊 Track Customer Satisfaction & NPS
Measure customer satisfaction (CSAT) and Net Promoter Score (NPS) with real-time tracking. Evaluate feedback from surveys, reviews, and ratings to assess how your customers feel about your products, services, and overall brand.
⚡ Customer Retention Metrics
Monitor retention rates, repeat business, and loyalty. Analyze trends in customer retention and identify areas where you can improve to increase customer loyalty and reduce churn.
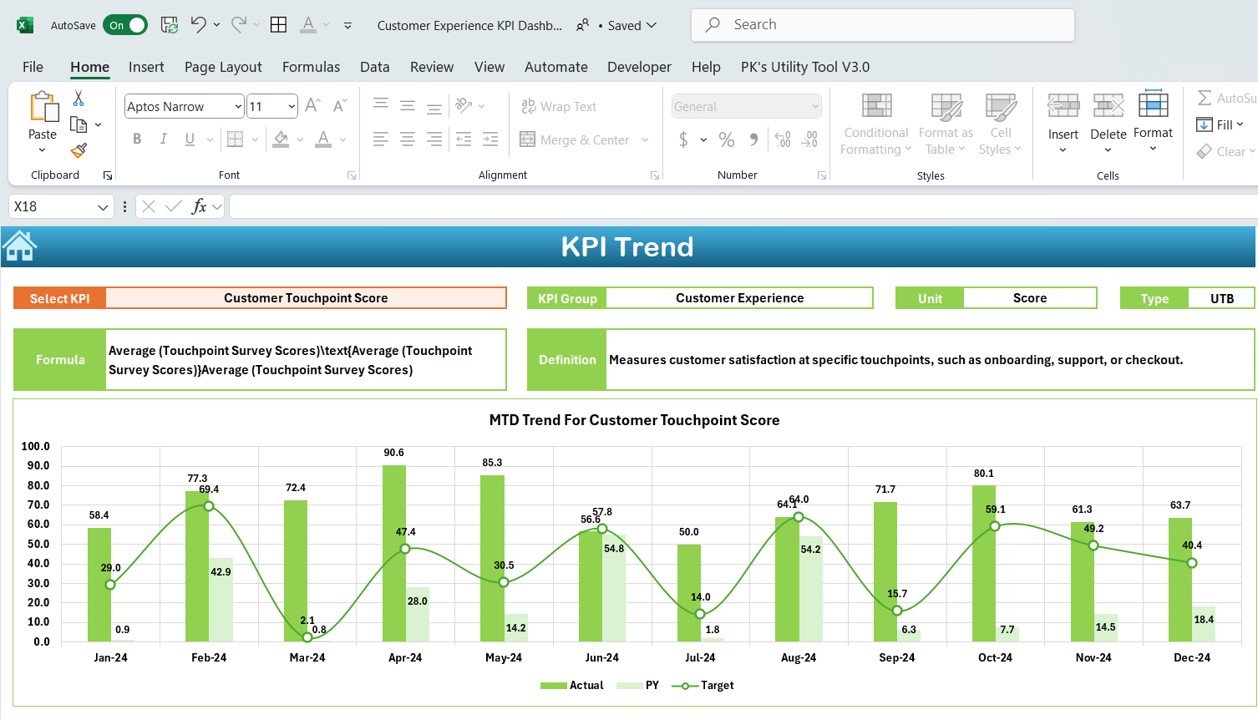
📈 Customer Service Response Times
Track how quickly your customer service team responds to queries, complaints, and requests. Monitor response times across different channels (phone, email, social media) to ensure timely and effective communication.
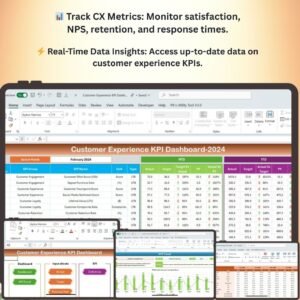
🛠️ Real-Time CX Insights
Access up-to-date data on key customer experience metrics. Use this information to make informed decisions about customer service improvements, product offerings, and engagement strategies.
🖥️ Interactive & User-Friendly Dashboard
The dashboard offers an interactive, easy-to-use interface that allows you to explore and analyze KPIs, identify trends, and gain actionable insights into your customer experience strategy.
Why You’ll Love the Customer Experience KPI Dashboard in Excel
✅ Measure Key CX Metrics
Track important customer experience KPIs like satisfaction, loyalty, retention, and response times to get a comprehensive view of your customer service performance.
✅ Optimize Customer Satisfaction & NPS
Regularly track customer feedback, satisfaction levels, and NPS scores to ensure that your customers are happy and loyal to your brand. Use insights to refine your CX strategy.
✅ Enhance Customer Retention
Understand your customer retention rates and identify trends that may indicate customer dissatisfaction. Take proactive measures to improve customer loyalty and reduce churn.
✅ Monitor Customer Service Efficiency
Track the response times of your customer service team and ensure that customers are receiving prompt and helpful support. Make improvements to optimize service quality.
✅ Make Data-Driven CX Decisions
Leverage the power of data to make informed decisions that enhance the customer experience. Improve your customer service, product offerings, and engagement strategies based on real-time insights.
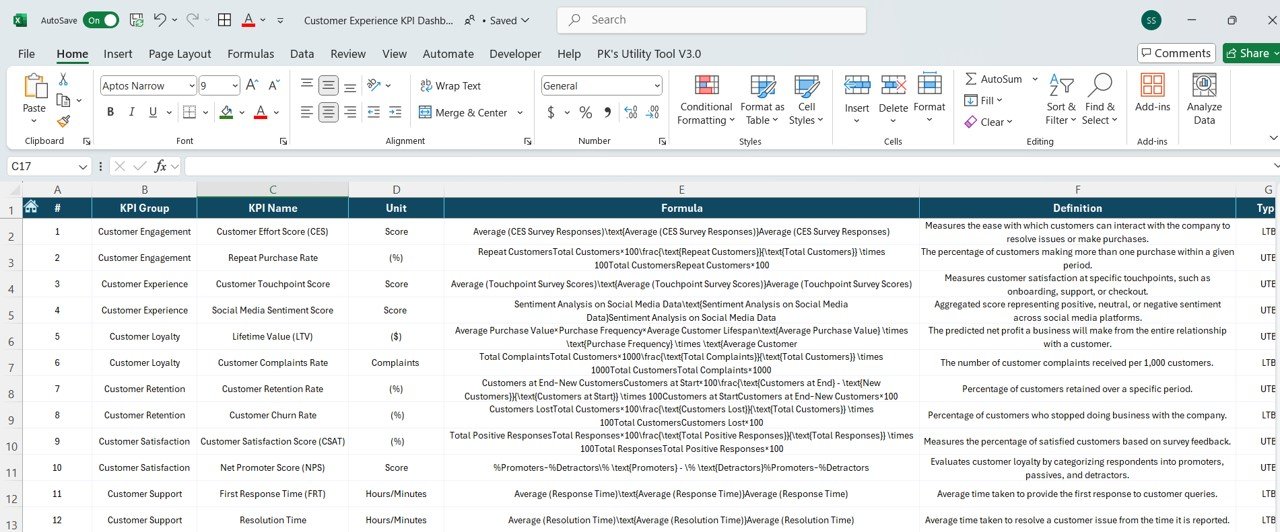
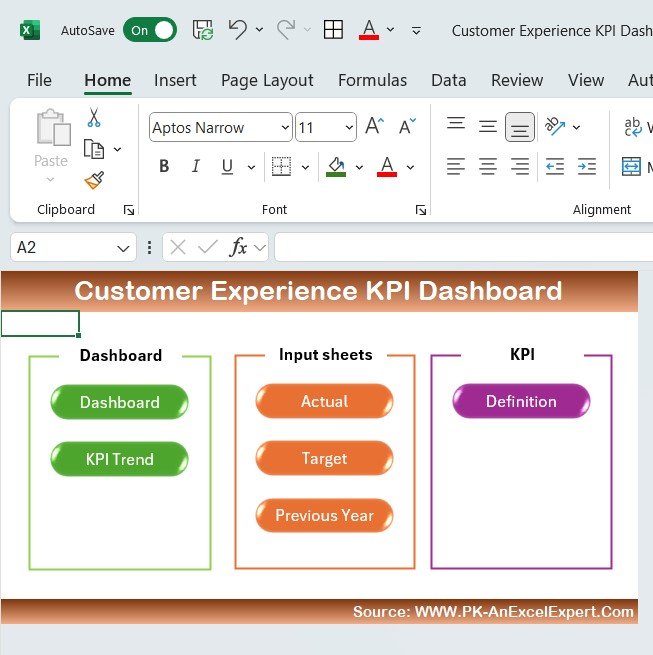
What’s Inside the Customer Experience KPI Dashboard Template?
- Customer Satisfaction & NPS Tracking: Monitor customer satisfaction and Net Promoter Score to gauge how customers feel about your brand.
- Retention Metrics: Track repeat business and customer loyalty, ensuring you are building long-lasting relationships.
- Response Time Monitoring: Keep track of customer service response times across multiple channels.
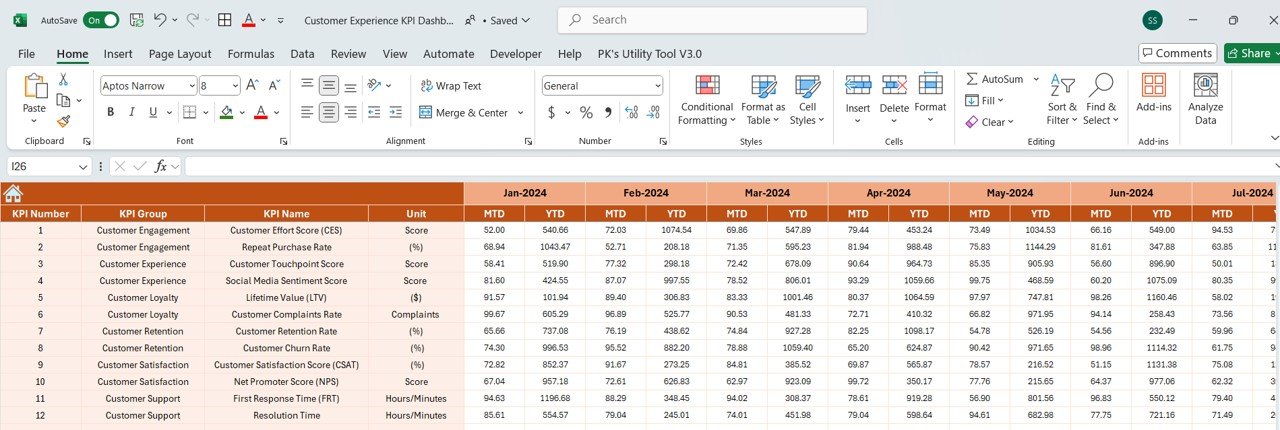
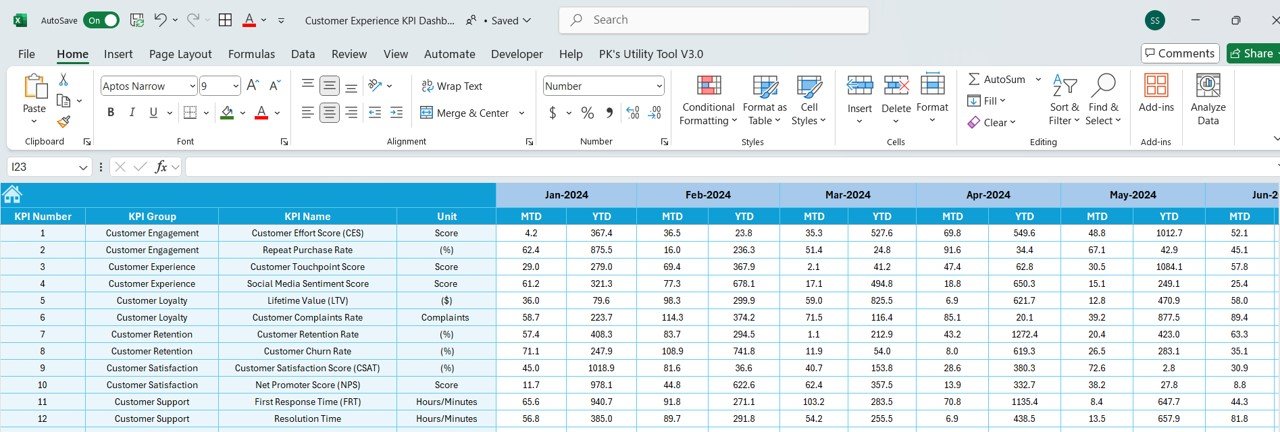
- Real-Time Data Insights: Stay updated on key CX metrics with real-time data.
- Customizable KPIs: Adjust the dashboard to track the specific customer experience metrics that matter most to your business.
How to Use the Customer Experience KPI Dashboard in Excel
1️⃣ Download the Template: Access your Customer Experience KPI Dashboard in Excel instantly.
2️⃣ Input CX Data: Enter customer satisfaction, NPS, retention, and response time data into the dashboard.
3️⃣ Track & Monitor KPIs: Use the dashboard to track and analyze key customer experience metrics in real-time.
4️⃣ Analyze & Improve: Use the insights from the dashboard to enhance your customer experience strategy and improve satisfaction levels.
Who Can Benefit from the Customer Experience KPI Dashboard in Excel?
🔹 Customer Service Managers & Teams
🔹 CX Professionals & Strategists
🔹 Business Owners & Managers
🔹 Marketing & Sales Teams
🔹 Anyone Interested in Enhancing Customer Experience & Satisfaction
Optimize and improve your customer experience strategy with the Customer Experience KPI Dashboard in Excel. Track satisfaction, retention, response times, and more to ensure your customers are happy and loyal to your brand.
Click here to read the Detailed blog post
Visit our YouTube channel to learn step-by-step video tutorials
Youtube.com/@PKAnExcelExpert


Reviews
There are no reviews yet.