



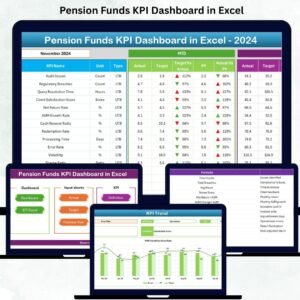
The Pension Fund KPI Dashboard in Excel is an essential tool for financial institutions, pension fund managers, and analysts. This Excel-based dashboard helps you track and manage key performance indicators (KPIs) related to pension funds, ensuring that you can make informed decisions and optimize fund performance. Whether you’re overseeing contributions, investment returns, or fund sustainability, this dashboard provides real-time insights into your pension fund’s health.
This comprehensive dashboard is designed to help you monitor essential metrics such as fund growth, returns on investments (ROI), contribution rates, and risk levels, ensuring your pension fund is operating effectively and meeting its financial goals. With its user-friendly interface, it allows you to assess the performance of your pension portfolio and identify opportunities for improvement.
Key Features of the Pension Fund KPI Dashboard in Excel
📈 Fund Performance & Growth Monitoring
Track the growth of your pension fund over time. Monitor how the fund is performing against expected growth rates and evaluate how well investments are contributing to overall fund value.
💸 Contribution Tracking
Monitor contributions from participants and employers. Track the total contributions and identify patterns to ensure consistent funding for the pension fund.
🔑 Investment Return Tracking
Track the returns on investments held within the pension fund. Analyze the performance of various asset classes, such as stocks, bonds, and alternative investments, to ensure the fund’s portfolio is balanced and performing well.
⚖️ Risk & Sustainability Analysis
Assess the risk level of the pension fund based on the asset allocation and investment returns. This feature helps you evaluate the fund’s sustainability and identify any potential risks to its long-term viability.
📅 Time-Based Performance Tracking
Track and assess the fund’s performance over different time periods (e.g., monthly, quarterly, annually). This allows you to identify short-term and long-term trends and ensure the pension fund is on track to meet its objectives.
⚙️ Customizable KPIs & Metrics
Customize the dashboard to track the specific KPIs most relevant to your pension fund management goals. Adjust the metrics, time frames, and financial goals according to your needs.
Why You’ll Love the Pension Fund KPI Dashboard in Excel

✅ Comprehensive Fund Monitoring
Easily track pension fund performance, from contributions to investment returns, in one place. Gain a complete overview of fund health with just a few clicks.
✅ Optimize Fund Growth
Monitor fund growth and returns to ensure the pension fund is meeting expected targets. Make adjustments to investment strategies to optimize returns and minimize risk.
✅ Ensure Fund Sustainability
Evaluate the long-term sustainability of the pension fund by tracking investment returns and contribution levels. This allows you to make proactive adjustments to maintain financial stability.
✅ Manage Risk Effectively
Track the fund’s risk levels and assess the effectiveness of your asset allocation strategies. Mitigate potential risks by identifying underperforming investments early.
✅ Tailored to Your Needs
This dashboard is fully customizable to fit the specific needs of your pension fund. Adjust KPIs and metrics to align with your unique fund objectives and management strategy.
What’s Inside the Pension Fund KPI Dashboard in Excel?
- Fund Performance Monitoring: Track overall fund growth and performance.
- Contribution Tracking: Monitor contributions from participants and employers.
- Investment Return Analysis: Track returns on various asset classes.
- Risk & Sustainability Assessment: Evaluate risk and ensure long-term fund sustainability.
- Time-Based Performance Tracking: Monitor the fund’s performance over time.
- Customizable Metrics & KPIs: Tailor the dashboard to meet your pension fund management goals.
How to Use the Pension Fund KPI Dashboard in Excel
1️⃣ Download the Template: Get instant access to the Pension Fund KPI Dashboard in Excel.
2️⃣ Input Data: Enter your pension fund contributions, investment returns, and asset allocations.
3️⃣ Track Fund Growth & Performance: Monitor the overall performance of your pension fund.
4️⃣ Assess Risk & Sustainability: Use the dashboard to evaluate risk levels and long-term sustainability.
5️⃣ Optimize Fund Strategies: Use the insights from the dashboard to make data-driven decisions and optimize the fund’s performance.
Who Can Benefit from the Pension Fund KPI Dashboard in Excel?
🔹 Pension Fund Managers & Analysts
🔹 Financial Institutions & Retirement Plan Providers
🔹 Investment Advisors & Consultants
🔹 HR & Employee Benefit Managers
🔹 Small & Medium Businesses (SMBs) with Pension Plans
🔹 Large Corporations & Pension Fund Trustees
🔹 Government Entities & Public Pension Plans
Ensure the financial health and growth of your pension fund with the Pension Fund KPI Dashboard in Excel. Track contributions, investment returns, and overall performance to make informed decisions that secure the future of your fund.
Click here to read the Detailed blog post
Visit our YouTube channel to learn step-by-step video tutorials
Youtube.com/@PKAnExcelExpert
Compatibility and Requirements
- Works in Microsoft Excel desktop (Excel 2016 or later, or Microsoft 365).
- New to Excel? Microsoft has a free guide: Excel for Windows training.
Frequently Asked Questions
What does the Pension Fund KPI Dashboard track?
It tracks fund growth, participant and employer contributions, investment returns by asset class, risk and long-term sustainability.
What data do I enter?
You enter pension fund contributions, investment returns and asset allocations.
Can I review performance over time?
Yes. You can follow the fund’s performance across different periods.
Is there a Google Sheets or Power BI version?
Yes. The Pension Fund KPI Dashboard in Google Sheets and the Power BI edition track the same KPIs.
Related Pension and Fund Templates
- Pension Fund KPI Dashboard in Google Sheets: the same dashboard in Google Sheets
- Pension Fund KPI Dashboard in Power BI: the same dashboard in Power BI
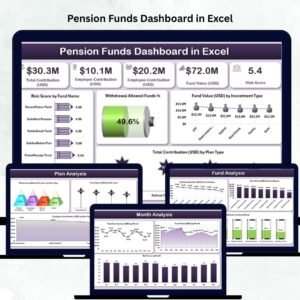
- Pension Funds Dashboard in Excel: a full pension funds dashboard in Excel
- Pension Funds KPI Dashboard in Excel: pension funds KPIs in Excel
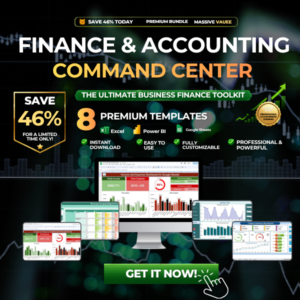
- Finance & Accounting Command Center: 8 finance and accounting templates in one download
Browse all Excel KPI dashboards or the Excel financial tools.












Reviews
There are no reviews yet.