

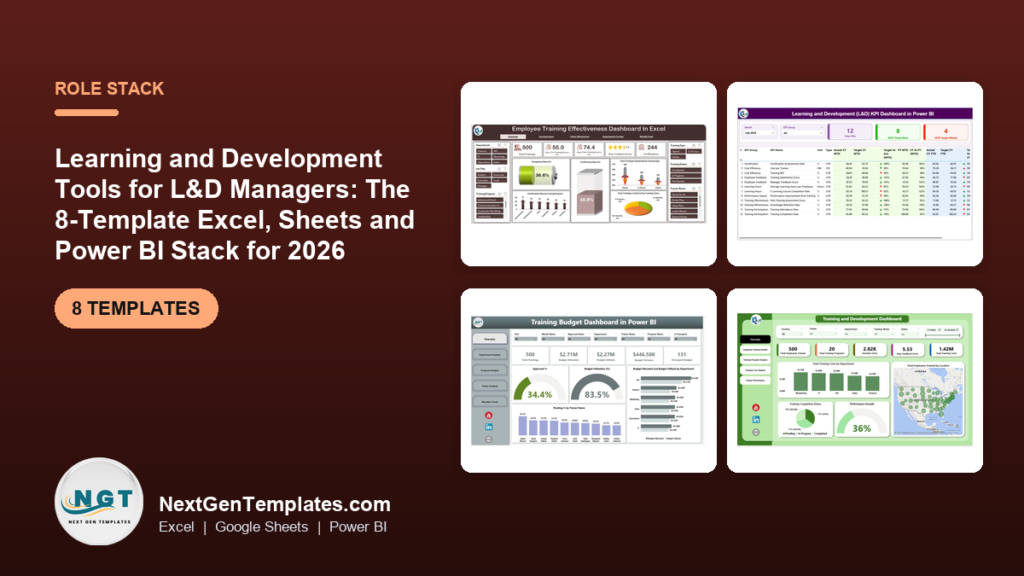
The best learning and development tools for an L&D manager who does not need a full LMS are eight one-time templates: two to plan training, two to track it, three to report on it, and one to present results. Our top pick is the Learning and Development (L&D) KPI Dashboard in Excel ($14.99, paid once).
Last updated: October 2026
Related guides: If you want the metrics before the tools, start with our 12 training KPIs every L&D team should track. If you only need a dashboard, our training and learning dashboard templates for L&D teams ranks the reporting files on their own. This post is wider: the eight learning and development tools an L&D manager actually works with, organised by the job each one does, plus a 30-day rollout plan and the kind of software each one can stand in for.
Key takeaways
- An L&D manager needs four kinds of learning and development tools: plan, track, report and present. Eight templates cover all four for $105.92 in total, paid once, with no per-learner or per-seat fees.
- Best overall is the L&D KPI Dashboard in Excel ($14.99): a monthly KPI pack with MTD and YTD actuals against target and last year, with no macros.
- Best value is the Training Completion Certification Tracker in Excel ($6.99): a login-protected training record with data-entry forms, 8 charts and 8 slicers.
- Completion rate, certification rate, pre- vs post-training score, cost per learner and training ROI are the five numbers an L&D manager is asked for most. The reporting templates here calculate all five.
- Templates lose to a learning management system when you need to host e-learning content, enrol hundreds of learners automatically or keep SCORM completion records for an audit. We say exactly when to buy software instead.
Learning and development tools compared
All eight learning and development tools side by side, grouped by the job they do, with the kind of paid software or manual work each one stands in for. One is marked best overall and one best value.
| # | Template | Job | Format | Best for | What it replaces | Price |
|---|---|---|---|---|---|---|
| 1 | Learning and Development (L&D) KPI Dashboard in Excel (Best overall) | Report | Excel (Google Sheets and Power BI editions available) | The monthly L&D KPI pack: MTD and YTD, against target and last year | A BI seat used only for the monthly training KPI page | $14.99 |
| 2 | Employee Training Effectiveness Dashboard in Excel | Report | Excel (Power BI edition available) | Pre- vs post-training scores, feedback and certification rate by trainer and department | The analytics add-on of a learning platform | $17.99 |
| 3 | Training Completion Certification Tracker in Excel (Best value) | Track | Excel VBA (Google Sheets edition available) | A secure training record: who completed what, certificate validity, follow-ups | The training-records module of an HRIS or LMS | $6.99 |
| 4 | Corporate Training Needs Survey Tracker in Google Sheets | Plan | Google Sheets | Collecting and prioritising training needs by department and area | A survey tool plus a hand-built summary spreadsheet | $6.99 |
| 5 | Training Schedule Request Tracker in Excel | Plan | Excel (with login and entry forms) | Training requests, approvals, dates, trainers and locations | Request emails and a shared calendar nobody keeps up to date | $6.99 |
| 6 | Training Budget Dashboard in Power BI | Track | Power BI | Budget allocated vs utilised by department, program, trainer and month | The budget tab finance rebuilds for you every quarter | $17.99 |
| 7 | Training ROI KPI Dashboard in Excel | Report | Excel | Proving training return with cost, effectiveness and engagement KPIs | A consultant-built ROI study | $14.99 |
| 8 | Training and Development Dashboard in Power BI | Present | Power BI (Excel and HTML editions available) | An interactive review with leadership: employees trained, programs, cost, trainers | A slide deck rebuilt by hand before every quarterly review | $17.99 |
How we picked these
We searched the full NextGenTemplates catalogue of Excel, Google Sheets, Power BI, VBA and HTML templates for everything an in-house L&D manager touches in a normal month. We kept a template only if it does one of the four jobs (plan, track, report, present) on its own, ships with editable formulas or a documented data sheet, and costs less than one month of the learning software it stands in for.
We left out near-duplicates and off-desk tools. The catalogue has several department-specific training KPI dashboards (for sales, IT, retail and HR teams); they share one structure, so we ranked the organisation-wide L&D version and left the department variants for teams that train only one function. Training-provider and institute dashboards (vocational, coaching and teacher-training businesses) are left out because they measure enrolments and revenue, not an employer’s learning programme.
What does an L&D manager need learning and development tools for?
The L&D manager sits between employees, who want relevant training at a sensible time, line managers, who want people back at their desks, and HR and finance leaders, who want to know whether the training budget changed anything. The year repeats a fairly fixed cycle: find the skill gaps, build the calendar, run and record the sessions, then prove the impact.
Most L&D teams run that cycle from a survey form, a calendar, a records spreadsheet and a slide deck that is rebuilt every quarter. The stack approach gives each job its own tool, fed by the same training records. It is the same logic we used in the HR templates stack for HR directors and the recruiting tools stack for recruiters, applied to the learning desk.
- Plan: training needs analysis and the request-to-schedule flow (templates 4 and 5).
- Track: completions, certificates and training spend (templates 3 and 6).
- Report: KPIs, effectiveness and ROI (templates 1, 2 and 7).
- Present: the quarterly leadership review (template 8).
The 8 best learning and development tools for 2026
1. Learning and Development (L&D) KPI Dashboard in Excel: best overall
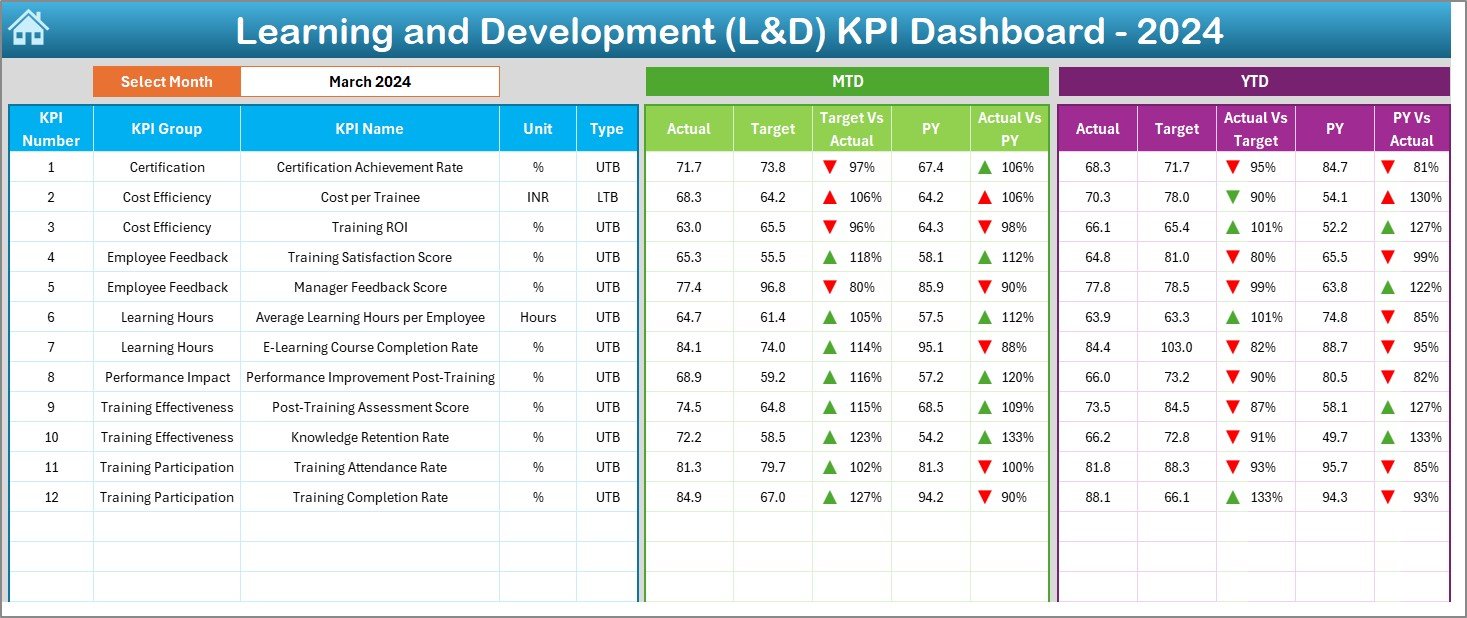
This ranks first because it answers the question an L&D manager hears every month: are we on target? It is a formula-only Excel workbook (no macros, no add-ins) with seven sheets: Home, Dashboard, KPI Trend, Actual Numbers, Target, Previous Year and KPI Definition.
What is inside:
- A month selector that switches the whole dashboard between reporting periods, with MTD and YTD values side by side.
- Actual vs target vs previous year for every KPI, with green and red arrows so misses stand out.
- A KPI Trend sheet: pick any KPI and see its MTD and YTD trend charts, plus its group, unit, type and formula.
- A KPI Definition sheet so everyone uses the same formula, including cost per employee and training ROI.
Use it to: send one KPI page to the HR director on the third working day of each month; show that certification achievement is 4 points below target YTD before the year-end review, not after; and keep the KPI formulas fixed when a new analyst takes over the pack.
Your team works in Google Sheets? Get the L&D KPI Dashboard in Google Sheets ($9.99). Your leadership lives in Power BI? Get the L&D KPI Dashboard in Power BI ($11.99).
Price: $14.99, one-time. Get the L&D KPI Dashboard in Excel
Best for: the L&D manager who owns the monthly KPI report.
2. Employee Training Effectiveness Dashboard in Excel
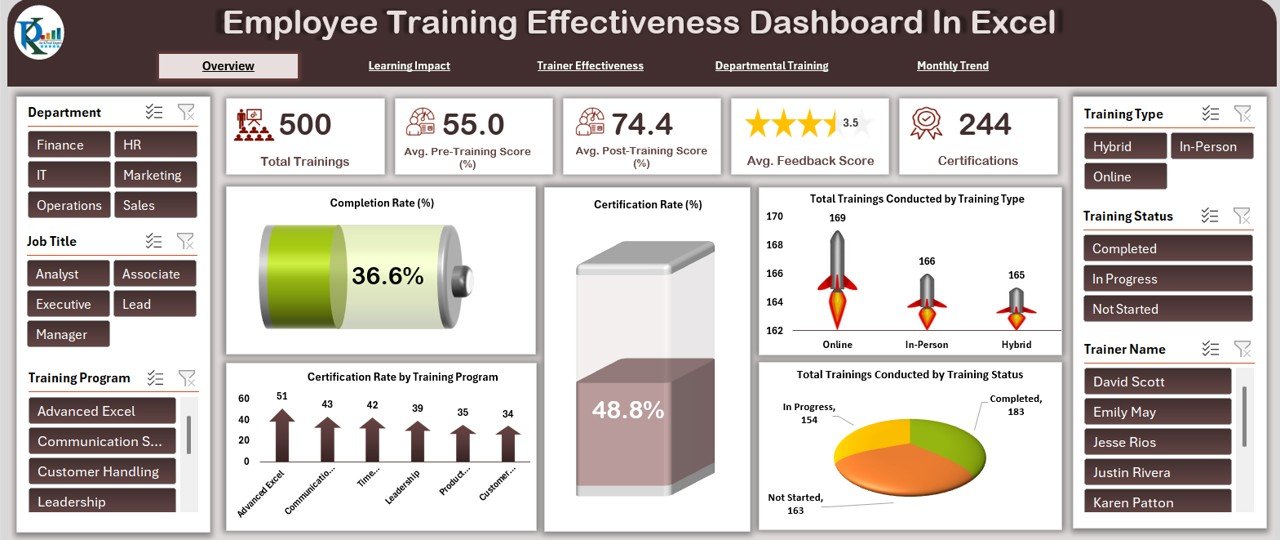
Completion tells you people turned up. This dashboard tells you whether they learned anything. It is built around one data sheet (trainer, program, department, pre- and post-training score, feedback, certification, duration, status and type) that feeds five analysis tabs.
What is inside:
- Overview cards for total trainings, average pre- and post-training score, average feedback score (1 to 5) and total certifications.
- A Learning Impact tab comparing pre- and post-training scores by program, with certification success by trainer.
- Trainer Effectiveness and Departmental Insights tabs, so you can see which trainer and which team gets the biggest score lift.
- A Monthly Trend tab for completion rates, scores, feedback and training volume.
Use it to: show that a negotiation course moved average assessment scores from 55 to 74; spot the trainer whose feedback is high but whose score lift is flat; and decide which program to cut before the next budget round. The same model is sold as the Employee Training Effectiveness Dashboard in Power BI ($17.99).
Price: $17.99, one-time. Get the Training Effectiveness Dashboard
Best for: proving learning impact at Kirkpatrick levels 1 and 2 (reaction and learning).
3. Training Completion Certification Tracker in Excel: best value
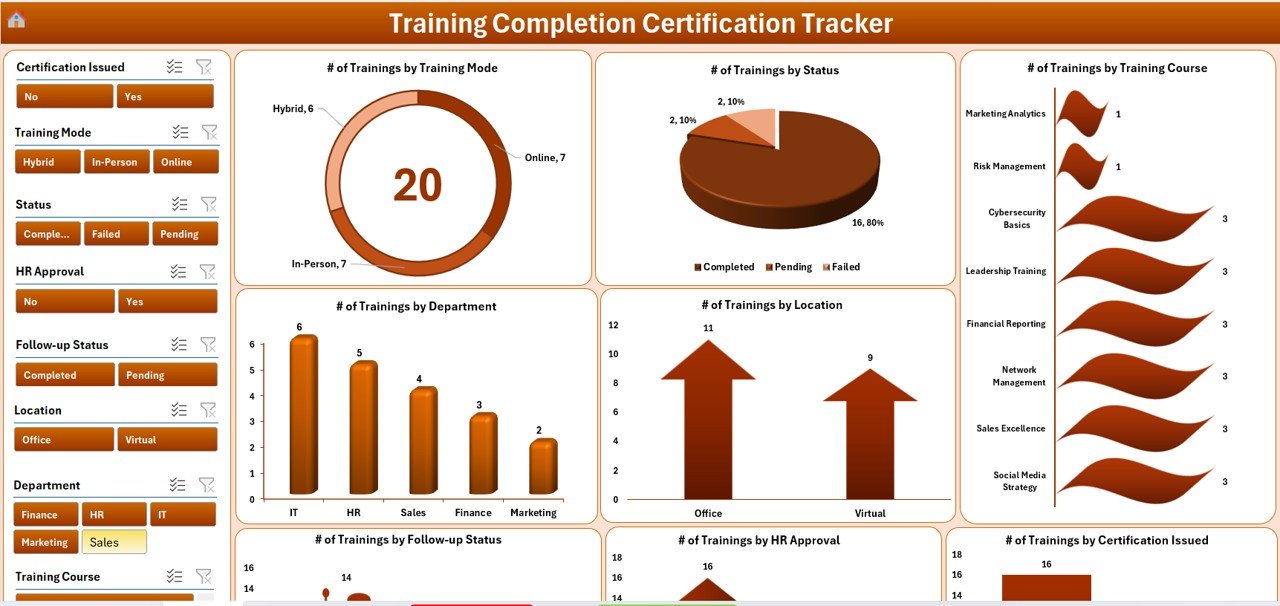
Every L&D team needs one trusted training record, and this is the cheapest way to get one that several people can update without breaking it. It is an Excel VBA tool with a secure login, role-based users and a main form for adding, updating and deleting records, so nobody types straight into the data table.
What is inside:
- A login panel and user management: add users, reset passwords and assign roles to HR, trainers or department heads.
- An interactive dashboard with 8 charts and 8 slicers by mode, course, status, department, approval, follow-up and location.
- A Manage List sheet for departments, courses, training modes and follow-up status, so dropdowns stay consistent.
- A Settings sheet for approval levels, default values and certificate validity ranges.
Use it to: answer “who has not completed fire-safety training this year?” in two clicks; chase overdue follow-ups by department; and hand an auditor a filtered list of valid certificates. Prefer a shared cloud file? The Training Completion Certification Tracker in Google Sheets costs the same $6.99.
Price: $6.99, one-time. Get the Certification Tracker
Best for: the employee training tracker every other tool in this stack reads from.
4. Corporate Training Needs Survey Tracker in Google Sheets

The training plan should start with a training needs analysis, not with last year’s calendar. This Google Sheets tracker turns survey responses into a prioritised list of skill gaps that managers can review and update together in real time.
What is inside:
- A tracker sheet with employee name and ID, department, training area, priority (low, medium, high), status (open, approved, planned, completed), preferred delivery mode and comments.
- Automatic charts for needs by status, by priority level, by training area and by department.
- A keyword and field search to find any request quickly.
- Real-time collaboration, so department heads add their team’s needs directly instead of emailing them.
Use it to: collect needs from 12 departments in two weeks; see that 40% of high-priority requests are for data skills and plan the year around that; and show managers which of their requests were approved, planned or completed.
Price: $6.99, one-time. Get the Training Needs Survey Tracker
Best for: a training needs analysis template the whole management team can contribute to.
5. Training Schedule Request Tracker in Excel
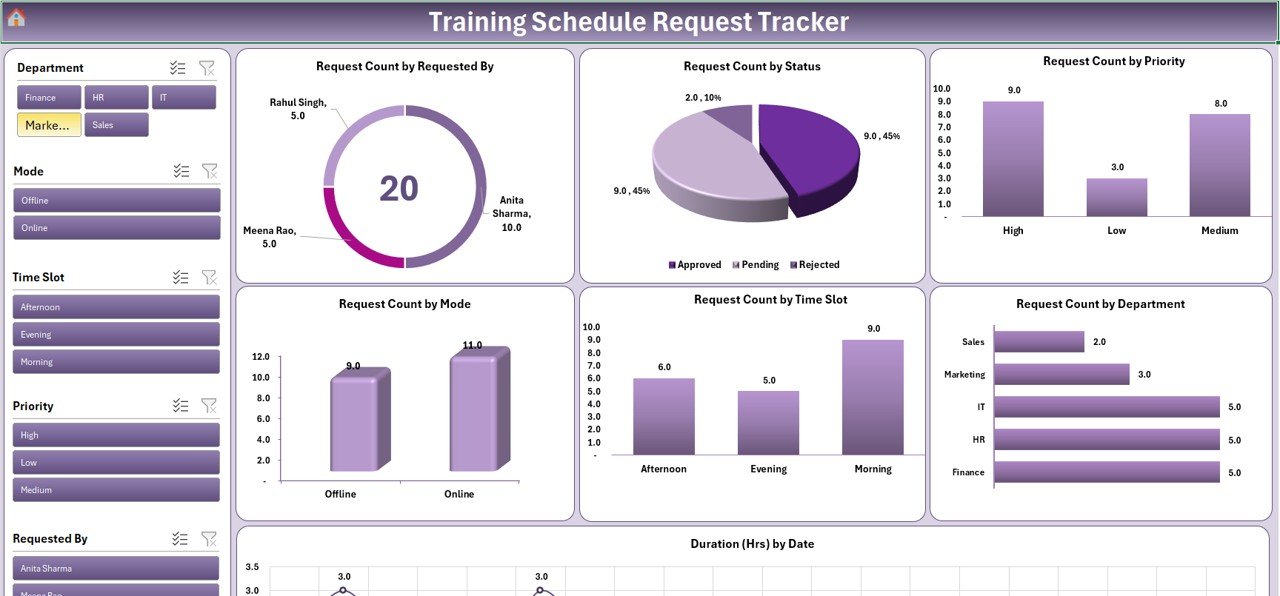
Once the needs are agreed, the requests start: “Can my team do the Excel course in March?” This tracker gives every request a status and turns approved requests into a schedule with dates, trainers and locations. It opens with a login screen and a menu for the dashboard, data entry and list management.
What is inside:
- Request capture: employee, requested topic, preferred dates and department.
- Status monitoring from pending to approved to completed, so no request is forgotten.
- Trainer and location allocation, so a room or a trainer is not booked twice.
- A dashboard with request counts by status, mode, priority and time slot.
Use it to: replace the training-request inbox; check trainer load before you approve another session; and show line managers exactly where their request sits. For a simple monthly view, add the Training and Onboarding Calendar in Excel ($4.99).
Price: $6.99, one-time. Get the Schedule Request Tracker
Best for: running the training calendar without a booking system.
6. Training Budget Dashboard in Power BI

The training budget is usually the first line finance questions. This five-page Power BI report shows where every training dollar was allocated, approved and actually spent, so you answer that question before it is asked.
What is inside:
- An Overview page with KPI cards for approved %, utilisation %, pending % and budget allocated vs utilised, plus slicers by department, trainer, program and month.
- Department Analysis: trainings, budget variance and overspend % by department.
- Program Analysis and Trainer Analysis: budget allocated vs utilised by program and by trainer, with reject % by trainer.
- Monthly Trends: trainings, overspend and allocation vs utilisation by month.
Use it to: find the department that has used 83% of its budget by Q3; move unspent budget before it is lost at year end; and show which programs consistently overspend. Power BI Desktop is free, so you can build and view the report without a paid licence.
Price: $17.99, one-time. Get the Training Budget Dashboard
Best for: keeping training spend under control in a medium or large company.
7. Training ROI KPI Dashboard in Excel

Return on investment is the number that protects the L&D budget. This Excel KPI dashboard tracks training cost (course fees, materials, trainer costs) next to effectiveness and engagement KPIs, with a KPI trend view and actual, target and previous-year input sheets.
What is inside:
- ROI monitoring that compares training cost with performance and productivity improvements.
- Training effectiveness KPIs such as completion and performance improvement.
- Cost analysis by program and engagement and satisfaction KPIs.
- Customisable KPIs, so you add the measures your leadership cares about.
Use it to: put a training ROI figure on the annual report; compare the return of a leadership program with that of a compliance program; and track whether cost per trainee falls as programs scale.
Price: $14.99, one-time. Get the Training ROI KPI Dashboard
Best for: the budget conversation at Kirkpatrick level 4 (results).
8. Training and Development Dashboard in Power BI

This is the one you open in front of leadership. The Power BI report starts with an overview of employees trained, training programs, duration, average feedback score and total training cost, then lets the room drill into employee training details, program analysis, cost analysis and trainer performance.
What is inside:
- Overview cards plus training cost by department, employees trained by location (map), completion status and performance growth.
- An Employee Training Details page with post- vs pre-training performance by position and completion status by department.
- Training Program, Training Cost and Trainer Performance pages.
- Slicers for position, trainer, department, training mode, status and date range.
Use it to: run the quarterly L&D review from one screen; answer “what did the sales team’s training cost per head?” live; and show performance growth by position after a program. Prefer a file? Get the Training and Development Dashboard in Excel ($17.99) or the browser-based Training and Development Dashboard in HTML ($12.99).
Price: $17.99, one-time. Get the Training and Development Dashboard
Best for: presenting the L&D story to leadership.
Start with the two files you will use every week. The Training Completion Certification Tracker ($6.99) holds the records, and the L&D KPI Dashboard in Excel ($14.99) turns them into the monthly report. That is $21.98, paid once.
The 30-day L&D manager rollout plan
Do not install eight tools in one afternoon. Roll the stack out in the order the data flows: records first, reports last.
| Week | Set up | Done when |
|---|---|---|
| Week 1 | Training Completion Certification Tracker (3): load this year’s completions, courses, departments and certificate validity; create user logins. | You can filter overdue and expiring certificates by department. |
| Week 2 | Training Needs Survey Tracker (4) and Schedule Request Tracker (5): send the needs survey; move open requests out of the inbox. | Every department has submitted needs and every request has a status. |
| Week 3 | L&D KPI Dashboard (1) and Training Budget Dashboard (6): agree the KPI list and targets; load budget allocations. | The first monthly KPI page and budget view are sent to HR and finance. |
| Week 4 | Training Effectiveness (2), Training ROI (7) and Training and Development Dashboard (8): add pre- and post-scores and costs; build the leadership view. | The quarterly review runs from the Power BI report, not a slide deck. |
Which training metrics should an L&D manager track?
Five numbers cover most questions. The full list, with benchmarks, is in our training KPIs guide.
| Metric | Formula | Worked example | Where it lives |
|---|---|---|---|
| Training completion rate | Completed enrolments / total enrolments x 100 | 342 of 380 = 90% | Templates 1, 3, 8 |
| Certification rate | Certified participants / total participants x 100 | 210 of 250 = 84% | Templates 1, 2, 3 |
| Score lift | Average post-training score – average pre-training score | 74 – 55 = 19 points | Template 2 |
| Cost per learner | Total training cost / number of learners | $45,000 / 300 = $150 | Templates 1, 6, 8 |
| Training ROI | (Monetary benefit – training cost) / training cost x 100 | ($60,000 – $45,000) / $45,000 = 33% | Template 7 |
The worked examples are illustrations, not benchmarks. The ROI formula follows the Phillips ROI method, which adds a fifth level to the Kirkpatrick four-level training evaluation model (reaction, learning, behaviour, results). Templates 2 and 7 between them cover levels 1, 2 and 4.
How to choose between them
| If your problem is… | Start with |
|---|---|
| “I don’t know who has completed what.” | 3. Training Completion Certification Tracker |
| “The training plan is last year’s plan.” | 4. Training Needs Survey Tracker |
| “Requests arrive by email and get lost.” | 5. Training Schedule Request Tracker |
| “HR wants a monthly KPI report.” | 1. L&D KPI Dashboard in Excel |
| “Leadership asks whether training works.” | 2. Training Effectiveness Dashboard, then 7. Training ROI KPI Dashboard |
| “Finance asks where the budget went.” | 6. Training Budget Dashboard in Power BI |
| “I need to present all of this quarterly.” | 8. Training and Development Dashboard in Power BI |
On format: Excel suits the report one L&D manager owns, Google Sheets suits data that many managers update, and Power BI suits interactive reviews. Our Excel vs Google Sheets vs Power BI comparison for HR dashboards goes deeper.
When a template is NOT the right answer
Templates are the right learning and development tools for planning, recording and reporting. They are the wrong tool in these situations:
- You need to deliver e-learning. None of these templates hosts courses, videos or quizzes. If employees need to take courses online, you need a learning management system such as TalentLMS, Docebo or Moodle. You can still use templates 1, 2 and 7 to report on the LMS export.
- You enrol hundreds of learners automatically. Automatic enrolment from your HRIS, reminder emails and self-service booking are LMS features. A spreadsheet works up to a few hundred records a year that one team maintains.
- You need audited compliance records. Regulated industries often need tamper-proof completion logs and SCORM or xAPI tracking. The certification tracker has logins and roles, but it is not a validated system.
- You run a training business. If you sell courses, your numbers are enrolments, revenue and trainer utilisation. Look at the corporate training provider and vocational training dashboards in our catalogue instead.
- You run the whole people function. If training is one of ten things you own, the HR & Workforce Analytics Bundle ($89.99) covers turnover, performance and attendance, and this stack adds the training layer.
Frequently asked questions
What are the best learning and development tools for a small company?
Start with a training record and a KPI report: the Training Completion Certification Tracker ($6.99) and the L&D KPI Dashboard in Excel ($14.99). Together they cost $21.98, paid once. Add the needs survey and schedule tracker when training requests grow beyond what one inbox can handle.
Can Excel be used as a training tracker?
Yes. Excel works well as an employee training tracker for a few hundred records a year. The Training Completion Certification Tracker adds a login, role-based users, data-entry forms and a dashboard with 8 charts and 8 slicers, so several people can update it without breaking formulas.
What should a training needs analysis template include?
Employee, department, training area, priority, status and preferred delivery mode, plus charts that summarise needs by priority, area and department. The Corporate Training Needs Survey Tracker in Google Sheets includes all of these, and managers can update it at the same time.
What should an L&D dashboard show?
Completion rate, certification rate, training hours, feedback score, cost per employee and training ROI, each against a target and last year, for the month and the year to date. The L&D KPI Dashboard in Excel shows exactly this, with arrows marking each KPI above or below target.
How do you calculate training ROI?
Subtract the training cost from the monetary benefit, divide by the training cost, and multiply by 100. If a program cost $45,000 and produced $60,000 of measurable benefit, ROI is 33%. The Training ROI KPI Dashboard in Excel tracks the cost and benefit KPIs month by month.
Is Excel, Google Sheets or Power BI better for L&D reporting?
Excel is best for the monthly report one person owns. Google Sheets is best when managers across departments update one shared file. Power BI is best for interactive reviews with leadership. Many L&D teams use all three: Sheets to collect, Excel to analyse and Power BI to present.
How much does the full L&D manager template stack cost?
All eight learning and development tools cost $105.92 in total, paid once. There are no per-learner fees, per-seat fees or renewals. You can buy each template on its own, so most teams start with two or three and add the rest as they need them.
Do I need Power BI Pro for the Power BI dashboards?
No. Power BI Desktop is free, and you can open, edit and view the Training Budget Dashboard and the Training and Development Dashboard with it. You need a Power BI Pro licence only to publish the report to the Power BI service and share it online.
Can I customise these training templates?
Yes. Every template is fully editable: add KPIs, rename departments and courses, change targets and add fields. The VBA trackers keep their dropdown values on a Manage List sheet, so you can change departments, courses and training modes without touching formulas.
Get more learning and development tools
Build your L&D stack today. Start with the L&D KPI Dashboard in Excel ($14.99) for the monthly report, or present to leadership with the Training and Development Dashboard in Power BI ($17.99). All eight templates are one-time purchases with instant download.
Want to see the dashboards in action first? Watch the walkthroughs on our NextGenTemplates YouTube channel.