

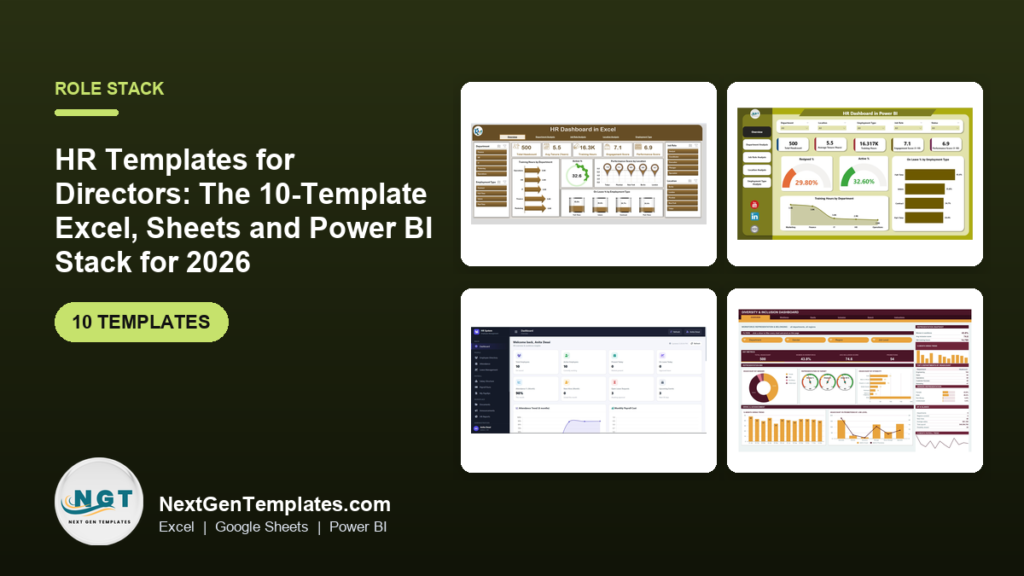
The best HR templates for an HR director who does not want another per-employee subscription are a stack of ten one-time tools: two to plan hiring and training, two to track employees, attendance and payroll, four to report on the workforce, one to present, and a bundle that covers ten more in one checkout. Our top pick is the HR Dashboard in Excel ($17.99, paid once).
Last updated: October 2026
Related guides: If you want the metrics before the tools, start with our 15 HR KPIs to track in 2026. This post is different: it is the working toolkit for the person who owns the people function, organised by the job each template does, with a 30-day rollout plan and the kind of HR software each one can stand in for.
Key takeaways
- An HR director needs four kinds of tool: plan, track, report and present. Ten HR templates cover all four for $292.90 in total, paid once, with no per-employee fees.
- Best overall is the HR Dashboard in Excel ($17.99): five pages for headcount, tenure, training hours, engagement and performance by department, job role, location and employment type.
- Best value is the HR & Workforce Analytics Bundle: ten Excel, Google Sheets and Power BI HR templates for $89.99 instead of $138.90 (35% off).
- Headcount, turnover rate, first-year attrition, time to fill, cost per hire, absenteeism, engagement score, training hours per employee and representation are the core of an HR director’s monthly board report.
- Templates lose to an HRIS when you need statutory payroll filing, benefits enrolment, employee self-service at scale or audited compliance records. We say exactly when to buy software instead.
HR templates compared
All ten templates side by side, grouped by the job they do, with the kind of paid HR software each can stand in for. One is marked best overall and one best value.
| # | Template | Job | Format | Best for | What it replaces | Price |
|---|---|---|---|---|---|---|
| 1 | HR Dashboard in Excel (Best overall) | Report | Excel | Monthly workforce review by department, role and location | The analytics add-on of an HRIS such as BambooHR or Workday (the reporting slice only) | $17.99 |
| 2 | HR & Workforce Analytics Bundle (Best value) | All four | Excel + Google Sheets + Power BI | Turnover, performance, attendance, safety, discipline and grievance in one checkout | Separate case-management, performance-review and attendance apps for a small HR team | $89.99 |
| 3 | HR Dashboard in Power BI | Present | Power BI | Interactive people review with the CEO and leadership team | A custom Power BI HR report built by a consultant | $17.99 |
| 4 | HR Employee Management System Web App | Track | Web app (Google Apps Script) | Employee records, attendance, leave, payroll runs, payslips and documents | Core HR modules of an SMB HR platform, for a small office | $39.99 |
| 5 | Recruitment & Talent Acquisition Bundle | Plan | Excel + Google Sheets | Hiring pipeline, funnel KPIs and onboarding | An entry-level applicant tracking system used mainly for reporting | $35.99 |
| 6 | Human Resources Employee Retention KPI Dashboard in Excel | Report | Excel | Retention KPIs, MTD and YTD, against target and last year | A BI seat used only for the monthly attrition page | $12.99 |
| 7 | Human Resources Employee Satisfaction KPI Dashboard in Excel | Report | Excel | Survey and engagement scores tracked month by month | The reporting view of an engagement-survey tool | $14.99 |
| 8 | Employee Training KPI Dashboard in Google Sheets | Plan | Google Sheets | L&D targets, completion and training cost shared with managers | The analytics tab of a learning management system | $12.99 |
| 9 | Diversity & Inclusion Dashboard in Google Sheets | Report | Google Sheets | Representation, pay and inclusion-survey reporting | DEI analytics modules sold on top of an HRIS | $9.99 |
| 10 | Employee Attendance Payroll Management System | Track | Web app (Google Apps Script) | Shift-based attendance, overtime, leave and salary slips across branches | Time-and-attendance software for a multi-branch workforce | $39.99 |
How we picked these
We searched the full NextGenTemplates catalogue of Excel, Google Sheets, Power BI and web-app templates for anything an HR director touches in a normal month. We kept a template only if it does one of the four jobs (plan, track, report, present) on its own, ships with editable formulas or a documented data sheet, and costs less than one month of the HR software it stands in for for a team of 50.
We left out near-duplicates. The catalogue has employee retention dashboards built for sales, IT and project teams; they are good, but an HR director needs one company-wide retention view, so we kept the HR edition and mention the other formats under it. We also left out industry-specific workforce dashboards, such as staffing-agency and training-institute reports. If you already know which HR dashboard format you prefer, our comparison of HR dashboards in Excel, Google Sheets and Power BI goes deeper on that one question.
What does an HR director need HR templates for?
The HR director sits between the CEO, who wants the right people in place at a predictable cost, the line managers, who want vacancies filled and problems solved, and the employees themselves. Their month repeats in a fairly fixed pattern: approve the hiring plan and chase open roles, keep attendance, leave and payroll clean, watch who is leaving and why, check that training budgets are being used, and explain headcount, cost and attrition to the leadership team in one meeting.
Most HR directors try to run all of that from HRIS exports pasted into one workbook that only they understand. The stack approach gives each job its own tool, fed by the same employee roster, payroll and survey exports. It is the same logic we used in the CFO dashboard template stack and the operations manager tools stack, applied to people.
- Plan: the hiring pipeline, onboarding and the training calendar (templates 5 and 8).
- Track: employee records, attendance, leave and payroll (templates 4 and 10, plus the VBA trackers inside the bundle at template 2).
- Report: workforce, retention, satisfaction and representation (templates 1, 6, 7 and 9).
- Present: an interactive people review for the CEO and leadership (template 3).
The 10 best HR templates for 2026
1. HR Dashboard in Excel: best overall
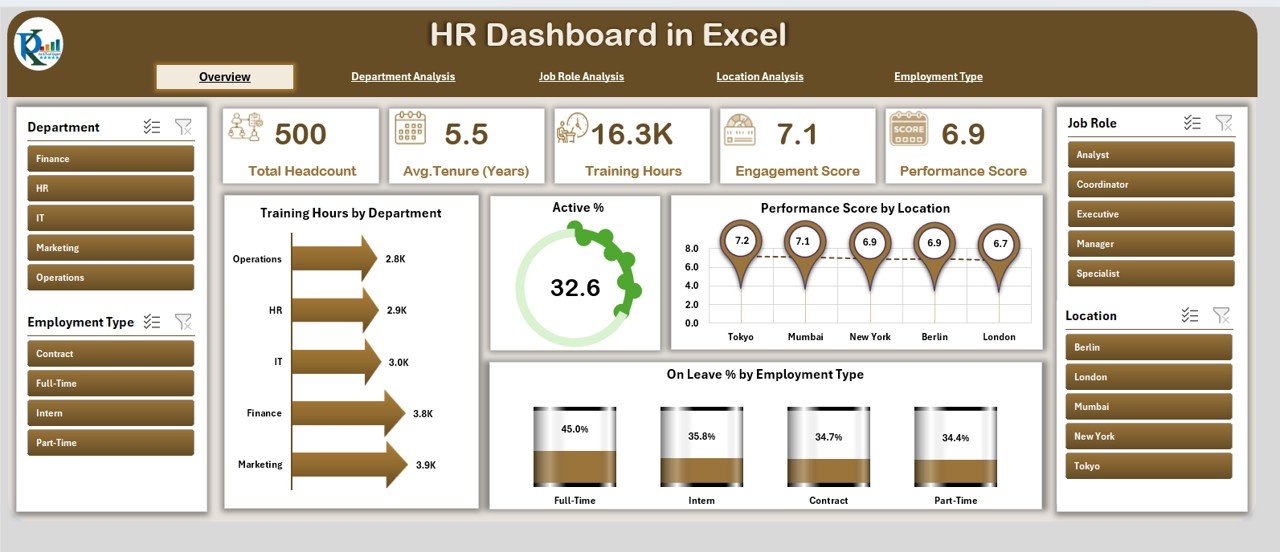
This is the monthly workforce report most HR directors try to build themselves and never finish. It has five analytical pages: Overview, Department, Job Role, Location and Employment Type. The Overview page opens with five KPI cards (Total Headcount, Average Tenure in years, Training Hours, Engagement Score and Performance Score), so the first question in any people review is answered before anyone asks it.
What is inside:
- Active percentage and on-leave percentage by employment type (full-time, part-time, contract and intern), so a shift in workforce mix shows up as a number.
- Training hours by department and performance score by location, side by side, to see whether training investment and results line up.
- Separate pages that repeat the core measures by department, job role, location and employment type, with slicers on each page.
- MTD and YTD views, fed by one support sheet you paste your employee roster into.
How HR directors use it: export the roster from your HRIS or payroll system at month end, paste it into the support sheet, refresh, and slice by department or location. “Which office has the lowest engagement and the highest leave rate?” becomes one click instead of an afternoon of COUNTIFS.
Why it is #1: it puts headcount, tenure, training, engagement and performance in one file, in the format every finance and leadership team already reads. No implementation partner, no per-employee licence, no connector to configure.
Price: $17.99, one-time. Get the HR Dashboard in Excel. The same five pages are available as the HR Dashboard in Power BI at #3.
Best for: the monthly workforce review owned by one HR director.
2. HR & Workforce Analytics Bundle: best value
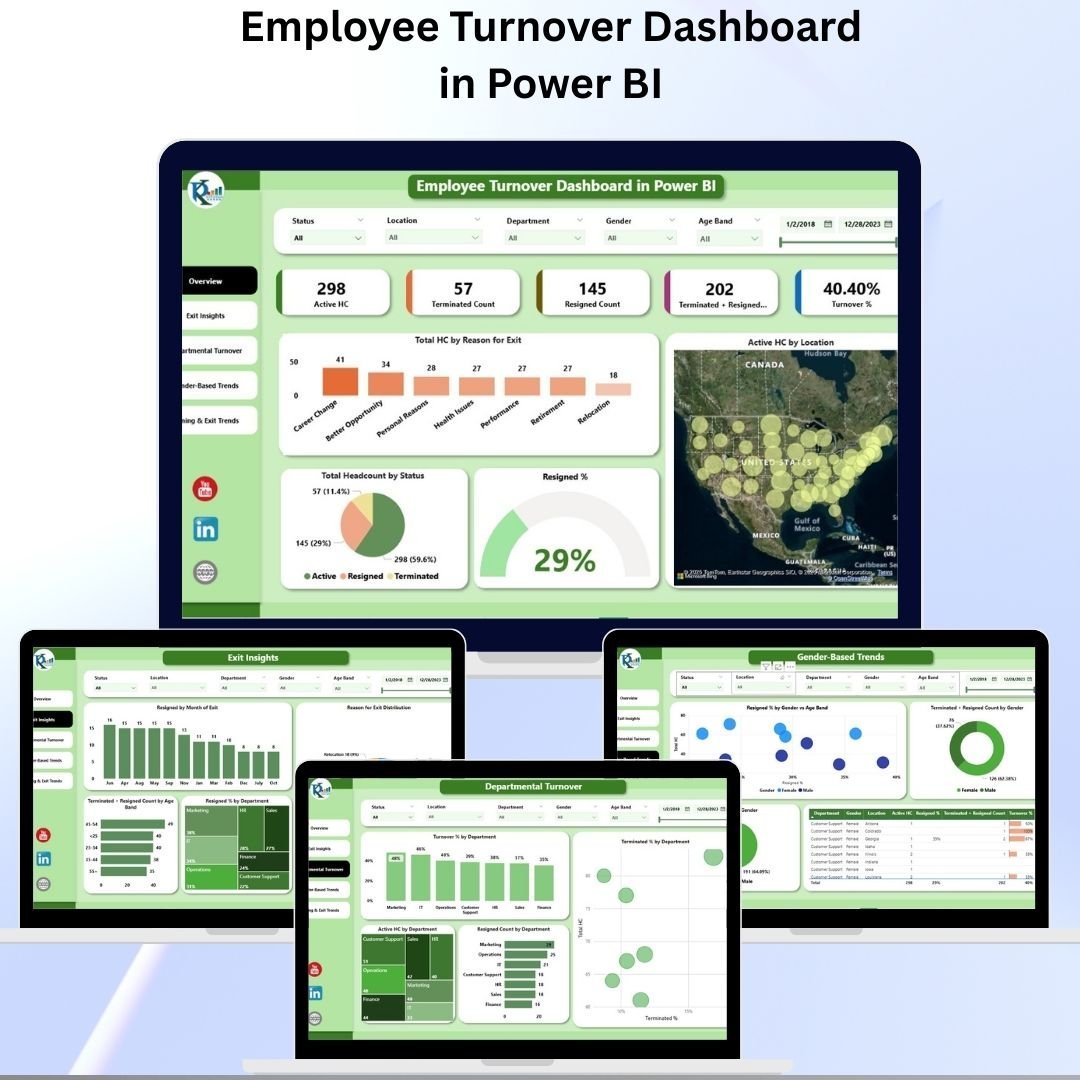
If you already know you need more than two tools, buy the bundle. It packs ten HR templates across Excel, Google Sheets and Power BI. Bought one by one they cost $138.90; the bundle is $89.99, a saving of $48.91, or 35%.
What is inside:
- An Employee Turnover Dashboard in Excel and the same report in Power BI: resignations, terminations, headcount and turnover %, with exit insights, departmental, gender and joining-and-exit trend pages.
- An Employee Performance Rating Card and Dashboard in Excel that scores employees across 10 parameters with weightages you set, and an HR Performance Dashboard in Excel for productivity, training completion, attendance and engagement.
- Three VBA trackers with login and data-entry forms: Employee Disciplinary Action Tracker, Employee Grievance Tracker and the Attendance and Overtime Dashboard.
- An Employee Health and Safety Dashboard in Excel for incidents and severity, plus two Google Sheets tools: an Attendance Sheet Template and an Employee Productivity Dashboard.
How HR directors use it: use the turnover dashboards for the monthly attrition page, the rating card for the review cycle, and the disciplinary and grievance trackers as your case log, so every case has a date, an owner and an outcome before anyone asks for it.
Price: $89.99, one-time. Get the HR & Workforce Analytics Bundle. None of the other nine picks here are inside it, so the bundle adds coverage rather than duplicating it.
Best for: an HR director setting up people analytics and case tracking from scratch.
3. HR Dashboard in Power BI

The presentation layer. It reads the same kind of employee data from Excel and turns it into an interactive Power BI report you click through in the leadership meeting instead of showing slides.
What is inside:
- An Overview page with Resigned %, Active % and On Leave % cards, employee type distribution and training hours by department.
- A Department Analysis page with average tenure and performance score (1–10) by department.
- A Job Role Analysis page with active %, engagement score and training hours by role.
- Location and Employment Type pages, with slicers for department, job role and location on every page.
How HR directors use it: present this to the CEO. When someone asks why resignations jumped in one office, filter to that location while everyone watches. Power BI Desktop is free; you only need a paid licence to publish and share the report online.
Price: $17.99, one-time. Get the HR Dashboard in Power BI.
Best for: quarterly people reviews with the CEO and the board.
4. HR Employee Management System Web App
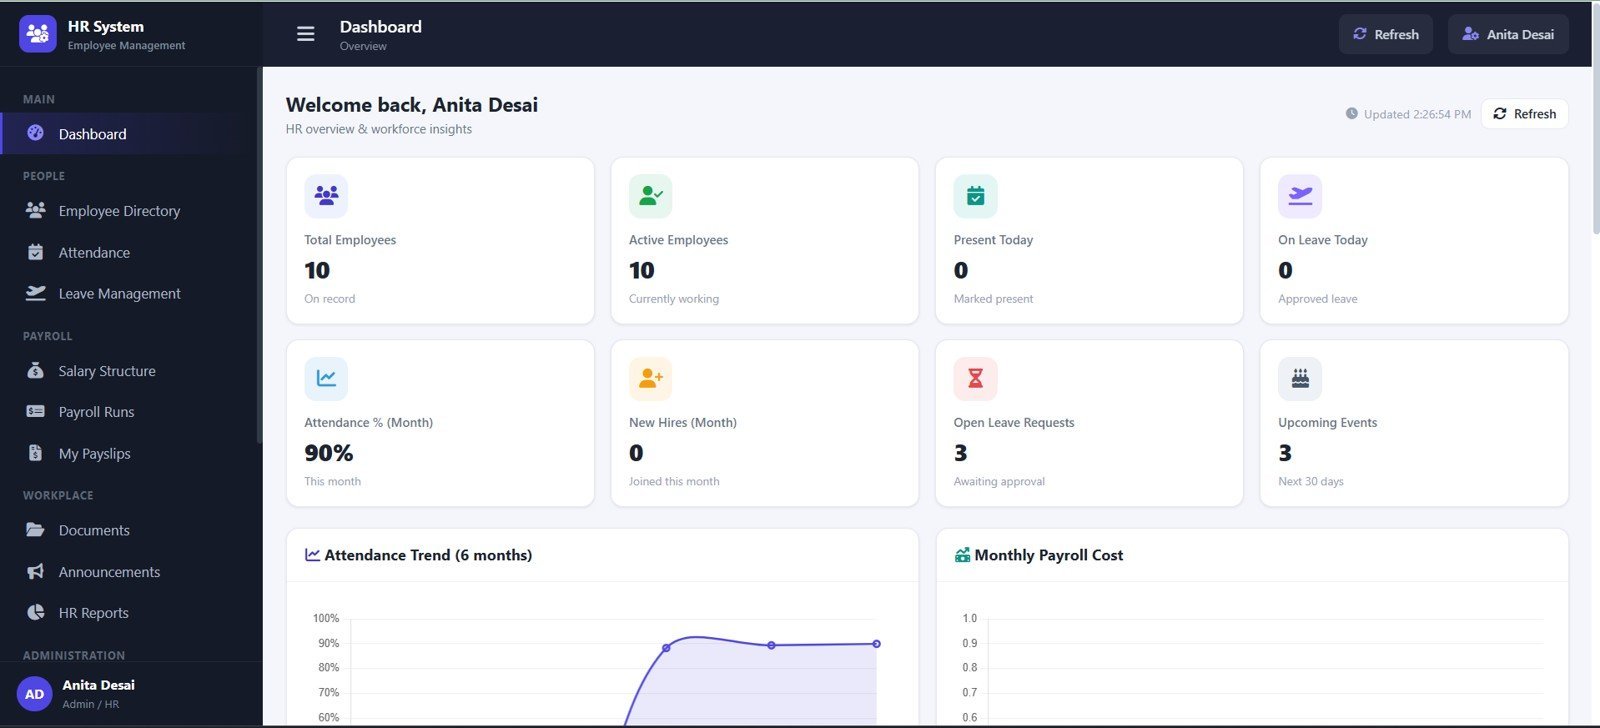
The system of record for a small HR team that has outgrown separate spreadsheets but is not ready for an HR platform priced per employee per month. It is a 16-page browser app that runs on Google Apps Script in your own Google account.
What is inside:
- An employee directory with department, designation, employment type, location, joined date and status.
- Attendance and leave pages: daily attendance with in and out times, leave requests, balances and approval status.
- Salary structure, payroll runs and a payslip workspace: gross pay, deductions, net payout, payable days and payslip status.
- Documents, announcements, HR reports, user management, settings, an archive and an audit log of user and login activity.
How HR directors use it: make it the one place where an employee’s record, leave and payslips live. Give HR staff and managers their own logins, and use the audit log when someone asks who changed a record.
Price: $39.99, one-time. Get the HR Employee Management System Web App. You get the full source code and a step-by-step guide to deploy it in your own Google account, and the product page has a live demo.
Best for: small businesses, schools, clinics and agencies that need records, leave and payroll in one controlled system.
5. Recruitment & Talent Acquisition Bundle

The planning side of the job: getting the right people in and up to speed. Seven hiring and onboarding templates in Excel and Google Sheets. Bought one by one they cost $56.93; the bundle is $35.99, a saving of $20.94, or 37%.
What is inside:
- A Recruitment Pipeline Dashboard in Google Sheets that recruiters and hiring managers update together, with time to fill, cost per hire and source effectiveness.
- A Recruitment Funnel KPI Dashboard in Excel for applied, screened, interviewed, offered and hired, with conversion between stages.
- A Recruitment and Hiring Dashboard in Excel for openings, applications, interviews, offers and hires.
- Four onboarding tools: an Employee Onboarding Tracker, an Onboarding Checklist, an Onboarding Planner Checklist and a New Hire Onboarding Calendar.
How HR directors use it: review the funnel weekly with recruiters and look for the stage where candidates stall. A low offer-acceptance rate is a pay or process conversation; a low screen-to-interview rate is a sourcing one. For the metrics in detail, see our recruitment KPIs guide.
Price: $35.99, one-time. Get the Recruitment & Talent Acquisition Bundle.
Best for: companies hiring every month and onboarding new starters without a dedicated talent team.
6. Human Resources Employee Retention KPI Dashboard in Excel
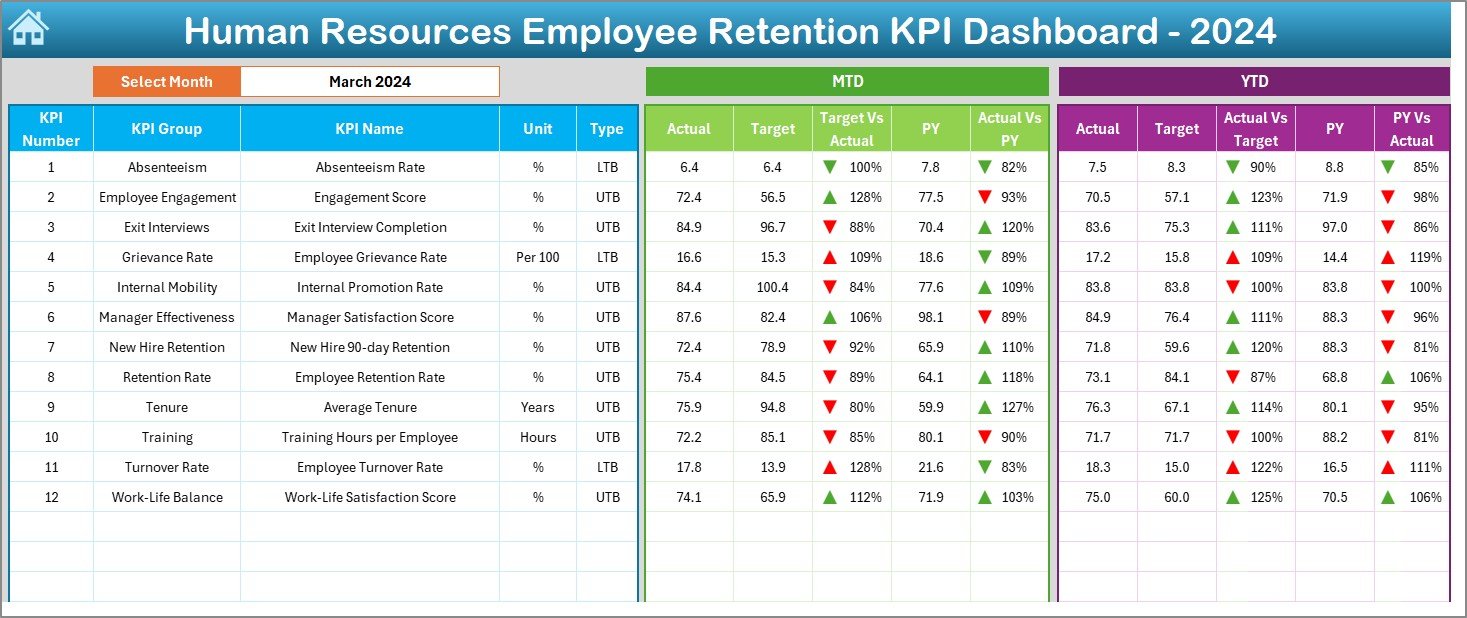
Template 1 shows who you have. This one shows whether you are keeping them: twelve retention KPIs against target and against last year, month to date and year to date.
What is inside:
- Twelve sample KPIs, including absenteeism rate, engagement score, exit interview completion, employee grievance rate, manager satisfaction score, new hire 90-day retention, employee retention rate, average tenure and employee turnover rate.
- A month selector that recalculates every KPI, with target-versus-actual and previous-year-versus-actual percentages.
- Green and red arrows for improvement and decline, so off-target KPIs stand out at a glance.
- A KPI Trend sheet and a KPI Definitions sheet, with Actual, Target and Previous Year input sheets.
How HR directors use it: agree retention targets with the CEO at the start of the year, enter actuals once a month, and send the dashboard sheet as the monthly retention page. The definitions sheet ends arguments about how turnover is calculated.
Price: $12.99, one-time. Get the Human Resources Employee Retention KPI Dashboard in Excel. Other formats: an Employee Retention KPI Dashboard in Google Sheets ($9.99), an Employee Retention Dashboard in Power BI ($17.99) and an Employee Turnover Dashboard in HTML ($12.99) that opens in any browser.
Best for: the monthly attrition page that goes to leadership.
7. Human Resources Employee Satisfaction KPI Dashboard in Excel
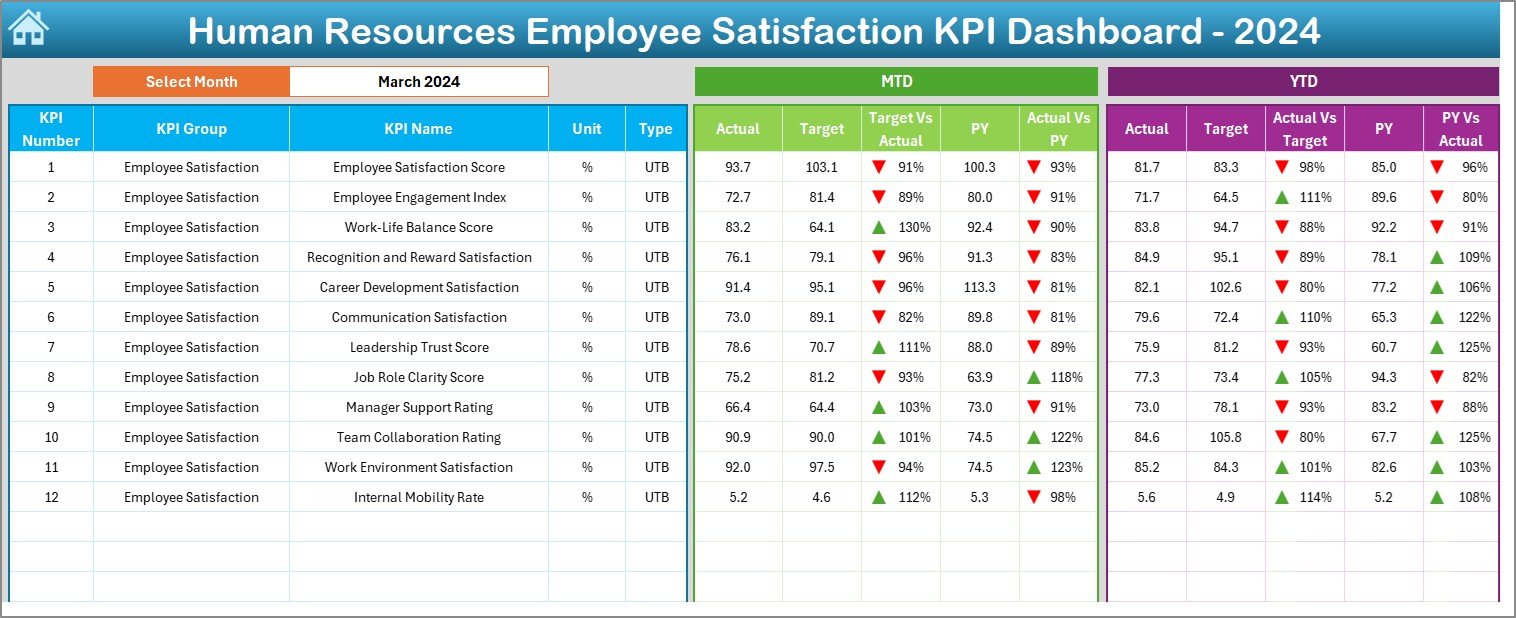
Retention numbers tell you who left. Satisfaction numbers tell you who is about to. This dashboard turns pulse-survey scores into a monthly KPI page with the same layout as template 6, so the two read together.
What is inside:
- Twelve sample KPIs, including employee satisfaction score, employee engagement index, work-life balance score, recognition and reward satisfaction, career development satisfaction, leadership trust score and internal mobility rate.
- MTD and YTD actual, target and previous-year columns, with variance arrows.
- A KPI Trend sheet to see whether a score is a one-month dip or a slide.
- Input sheets for actuals, targets and last year, and a definitions sheet you can edit.
How HR directors use it: run a short pulse survey each month or quarter, enter the average scores, and put this page next to the retention page. A falling leadership trust score in one department is the early warning before resignations follow.
Price: $14.99, one-time. Get the Human Resources Employee Satisfaction KPI Dashboard in Excel.
Best for: HR directors who run engagement surveys and need to show the trend, not just the latest score.
8. Employee Training KPI Dashboard in Google Sheets

The learning and development plan, in a file your L&D lead and line managers can all open. It tracks participation, completion, training hours and training cost against targets.
What is inside:
- A dashboard tab with a month selector that refreshes every KPI, showing actual, target and previous year for MTD and YTD.
- Sample KPIs for training efficiency, impact and utilisation, such as training completion rate, training attendance rate, knowledge retention rate, average training hours per employee and training cost per employee.
- Green and red arrows for improvement and decline, and a KPI trend view for month-by-month movement.
- Google Sheets sharing, so L&D, HR and managers see the same numbers in real time.
How HR directors use it: set the year’s training budget and hours targets in January, share view access with department heads, and ask the L&D lead to update actuals monthly. Underused budgets show up in the second quarter, not in December.
Price: $12.99, one-time. Get the Employee Training KPI Dashboard in Google Sheets.
Best for: planning and tracking the training budget across departments.
9. Diversity & Inclusion Dashboard in Google Sheets
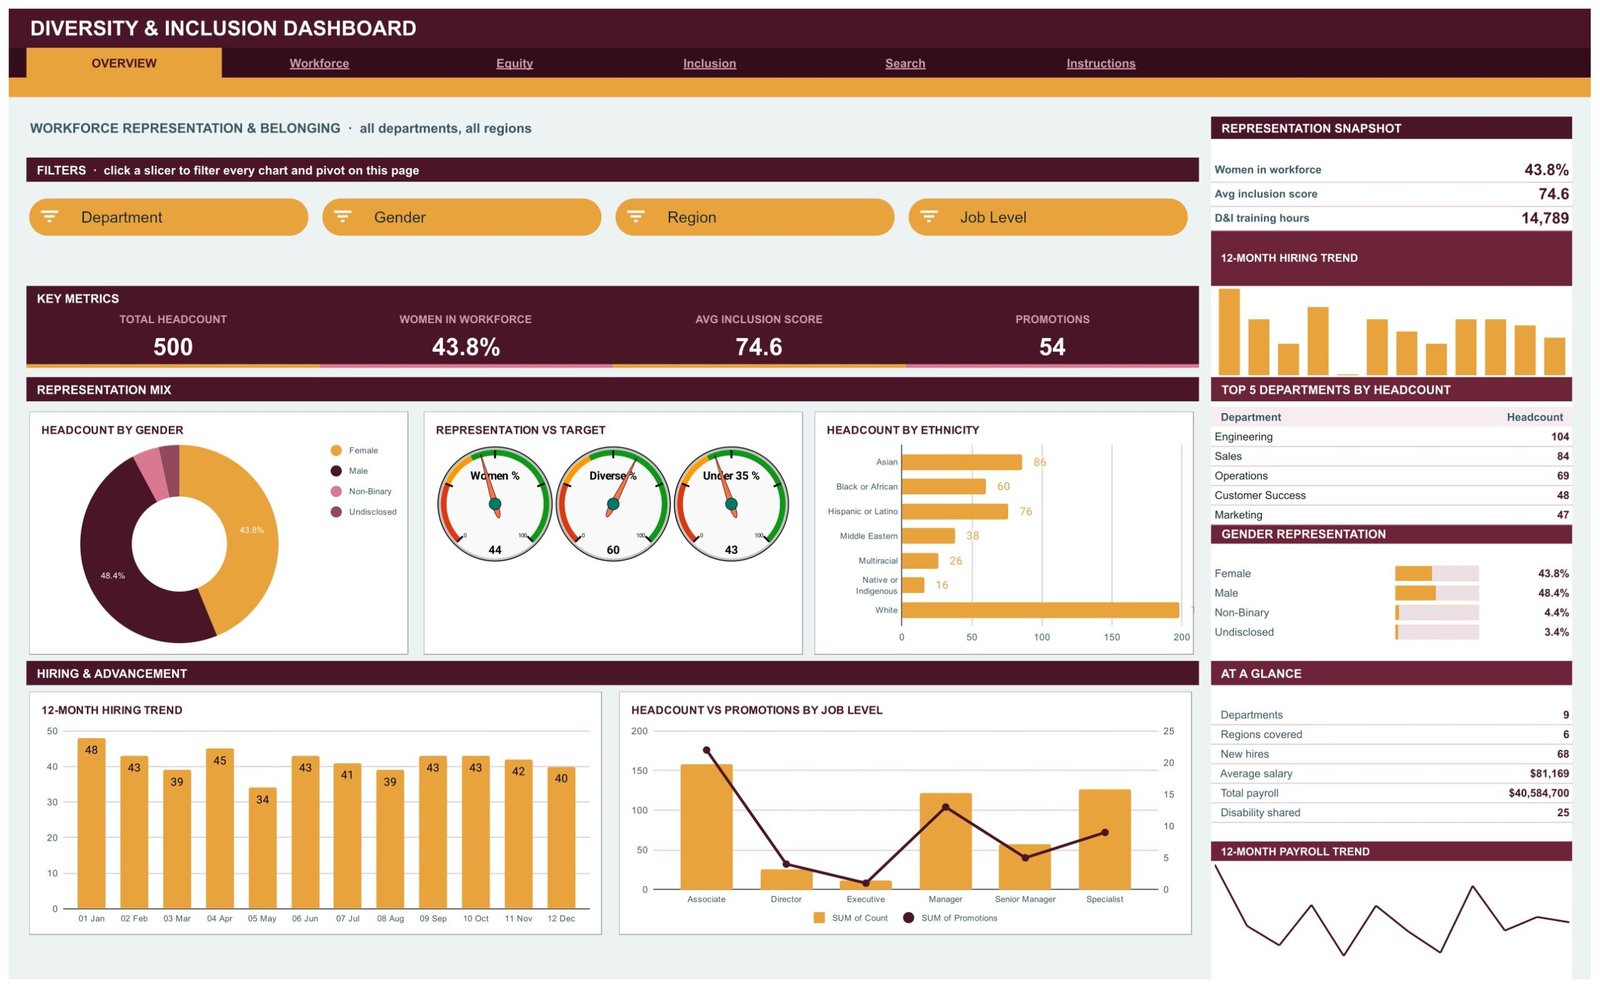
Representation and pay questions now reach the HR director from the board, investors and job candidates. This workbook turns a flat employee list into six linked pages of representation, pay and inclusion-survey reporting, built on native Google Sheets pivot tables and slicers.
What is inside:
- Six tabs: Overview, Workforce, Equity, Inclusion, Search and Instructions.
- 16 KPI cards, including total headcount, women in workforce, women in leadership, average and median salary, promotions, training hours and average inclusion score.
- 18 charts and 16 slicers, four per analysis page, filtering by department, gender, region, job level, age group and ethnicity.
- An employee lookup page and 500 sample records, pre-extended to 1,000 rows so your own export redraws every chart.
How HR directors use it: run it once a quarter on the HRIS export and take the Equity page to the pay review. It charts the figures you put in; it does not grade your organisation or produce any statutory return, which the product page says plainly.
Price: $9.99, one-time. Get the Diversity & Inclusion Dashboard in Google Sheets.
Best for: quarterly representation and pay-equity reporting.
10. Employee Attendance Payroll Management System
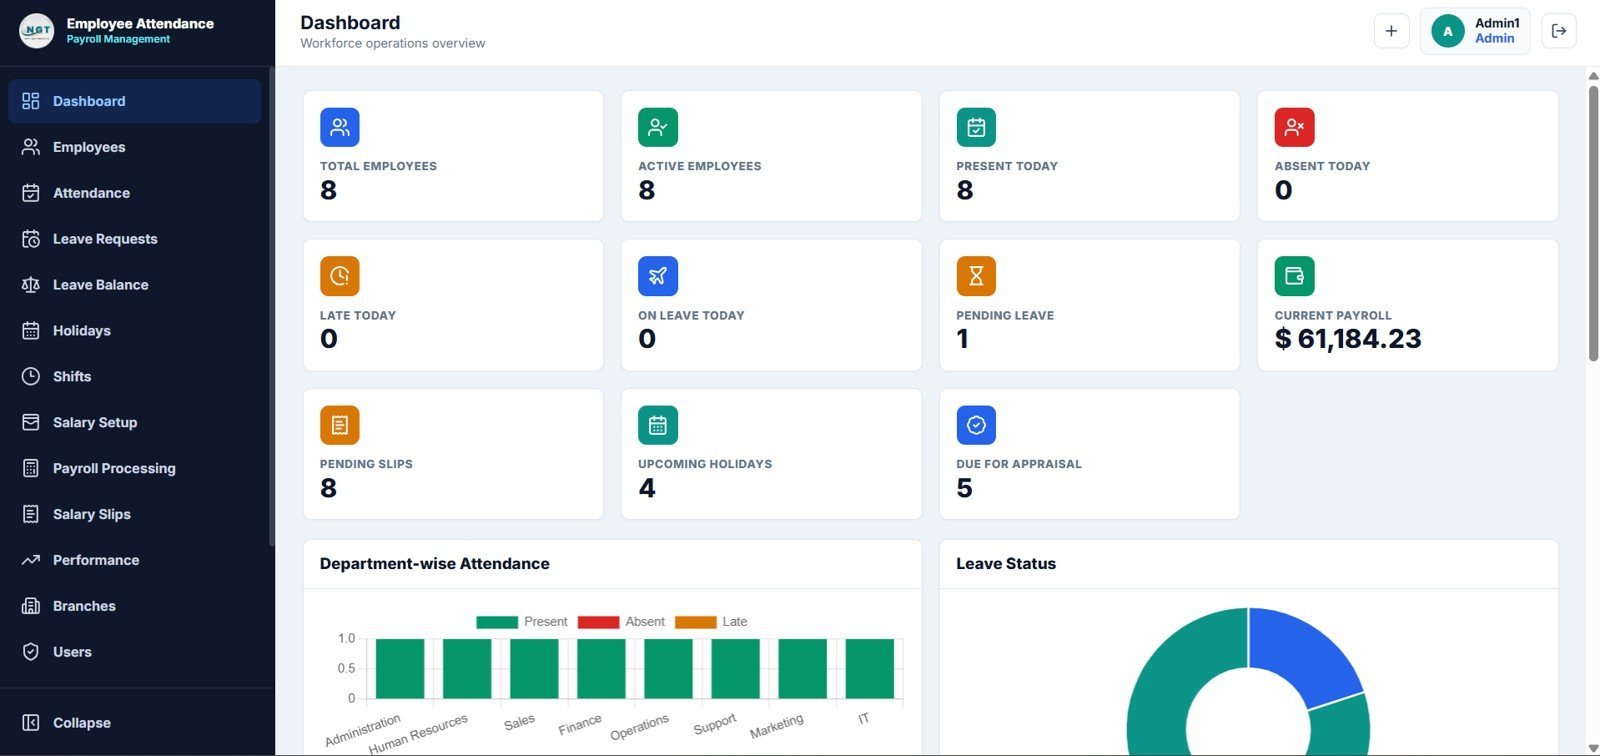
Template 4 is built around the office employee lifecycle. This one is built around shifts: when the workforce clocks in at several branches and late minutes and overtime decide the payroll, it is the better fit. It is a 15-page web app on Google Apps Script.
What is inside:
- Dashboard cards for total and active employees, present, absent and late today, on leave today, pending leave, current payroll, pending slips, upcoming holidays and appraisals due.
- Attendance with check-in, check-out, shift, status, late minutes, early leave, overtime and working hours.
- Leave requests, approvals, balances and adjustments, and a payroll workflow with paid days, loss-of-pay days, earnings, deductions and salary slips.
- Admin pages for shifts, holidays, branches, performance reviews and user accounts, with admin, HR and employee roles.
How HR directors use it: set up branches and shifts first, then let branch HR staff record attendance daily. At month end, payroll reads paid days and overtime straight from attendance, so the two never disagree.
Price: $39.99, one-time. Get the Employee Attendance Payroll Management System. The product page has a live demo you can try before buying.
Best for: retail, clinics, service and branch businesses with shift-based staff.
Short on time? Start with the HR Dashboard in Excel for $17.99, or get ten HR templates in the HR & Workforce Analytics Bundle for $89.99 (save $48.91).
The 30-day HR director rollout plan
Don’t install ten tools in one week. Roll them out in the order the data flows, so each tool feeds the next one.
| Days | Tool | Goal by the end of the step |
|---|---|---|
| 1–5 | HR Employee Management System or Attendance Payroll System | Clean employee master: one row per person, with department, location, type, join date and status |
| 6–9 | HR Dashboard in Excel | First monthly workforce report by department, role, location and employment type |
| 10–13 | Employee Retention KPI Dashboard | Retention targets agreed with the CEO; last year’s numbers entered; each KPI has an owner |
| 14–17 | Recruitment & Talent Acquisition Bundle | All open roles in the pipeline; onboarding checklist used for the next new starter |
| 18–21 | Employee Satisfaction KPI and Training KPI dashboards | Last survey scores and this year’s training targets loaded |
| 22–25 | Diversity & Inclusion Dashboard and the bundle’s case trackers | Representation baseline; open disciplinary and grievance cases logged |
| 26–30 | HR Dashboard in Power BI | First interactive people review presented to the leadership team |
Most of the time goes into cleaning department names, job titles and employee statuses, not into configuring templates. Each single HR dashboard takes under an hour to set up once your export is ready.
Which HR metrics should an HR director track?
Ten metrics are enough for a monthly people report. The definitions below follow common practice from SHRM, the largest professional body for HR, and you can benchmark turnover against the US Bureau of Labor Statistics Job Openings and Labor Turnover Survey (JOLTS), which publishes quits and separations rates by industry every month. Every template in this stack lets you edit the KPI list and targets.
| Metric | Formula | What it tells you |
|---|---|---|
| Headcount | Active employees on the last day of the period | The base every other rate is calculated on |
| Turnover rate | Leavers in the period ÷ average headcount in the period | How fast the workforce is being replaced |
| Voluntary turnover rate | Resignations ÷ average headcount | The part of turnover you can influence |
| First-year attrition | Leavers with under 12 months’ service ÷ hires in the same 12 months | Whether hiring and onboarding work |
| Time to fill | Average days from requisition approved to offer accepted | How long roles stay empty |
| Cost per hire | (Internal + external recruiting costs) ÷ hires | What each new starter costs to bring in |
| Absenteeism rate | Unplanned absence days ÷ scheduled working days | Hidden capacity loss and a wellbeing signal |
| Engagement score | Average of agreed survey questions, on a fixed scale | Whether people intend to stay and put in effort |
| Training hours per employee | Total training hours ÷ average headcount | Whether the development budget is being used |
| Women in leadership | Women in manager-and-above roles ÷ all manager-and-above roles | Progress on representation where it is usually lowest |
For targets and ready-made dashboards for each metric, read our guide to HR KPIs to track in 2026, and for exit and retention measures see our retention metrics guide. For more HR dashboard layouts, see our round-up of the best HR dashboard templates in Excel.
How to choose between them
- You need one people report by Friday: start with the HR Dashboard in Excel ($17.99).
- You are building HR analytics and case tracking from nothing: buy the HR & Workforce Analytics Bundle ($89.99).
- Your CEO lives in Power BI: the HR Dashboard in Power BI ($17.99).
- Employee records, leave and payslips are scattered across files: the HR Employee Management System Web App ($39.99).
- Your staff work shifts across branches: the Employee Attendance Payroll Management System ($39.99).
- Roles stay open too long: the Recruitment & Talent Acquisition Bundle ($35.99).
- People keep leaving: the Employee Retention KPI Dashboard ($12.99) next to the Employee Satisfaction KPI Dashboard ($14.99).
Excel HR templates and Google Sheets HR templates handle reporting and small-team tracking; an HRIS handles compliance and self-service at scale. The next section says where that line falls.
When a template is NOT the right answer
HR templates are the right HR tools for most small and mid-sized businesses, but not for every people team. Buy dedicated HR software, such as BambooHR, Rippling, HiBob, Workday or ADP, when:
- Payroll must file taxes for you. Statutory payroll calculation, tax filing and year-end forms belong in a payroll provider, not a spreadsheet or a template web app.
- You administer benefits. Enrolment windows, carrier feeds and eligibility rules need a benefits system.
- Hundreds of employees need self-service. Mobile apps, e-signatures and approval chains across many managers are HRIS territory.
- Auditors need controlled records. If regulators or auditors require tamper-evident HR records and formal retention policies, use a system built for that.
Even then, many HR directors keep Excel or Power BI dashboards on top of the HRIS, because they are faster to change than the HRIS’s own reports. That reporting layer is exactly where templates 1, 3, 6, 7 and 9 fit.
Frequently asked questions
What are the best HR templates for a small company?
For a small company, the HR Dashboard in Excel ($17.99) is our top pick because it covers headcount, tenure, training, engagement and performance by department, role and location in one file. For a complete set, the HR & Workforce Analytics Bundle gives you ten Excel, Google Sheets and Power BI HR templates for $89.99.
What should an HR director dashboard show?
An HR director dashboard should show headcount, turnover and voluntary turnover, first-year attrition, open roles and time to fill, absenteeism, engagement score and training hours, split by department, location and employment type. Add filters for each, so every question in a leadership review can be answered with one click.
Can Excel replace HR software?
For reporting, retention tracking, survey trends, training plans and small-team records, often yes. The templates here handle all of that. Excel does not replace HR software for statutory payroll filing, benefits administration, employee self-service for hundreds of people or audited compliance records.
Is Excel, Google Sheets or Power BI better for HR reporting?
Excel is best for the monthly report one HR director owns. Google Sheets is best when HR, L&D and managers all update one shared file. Power BI is best for interactive reviews with the CEO and board. Many HR teams use all three: Sheets to collect, Excel to analyse and Power BI to present.
How much does the full HR template stack cost?
All ten templates cost $292.90 in total, paid once. That is two bundles ($89.99 and $35.99), two web apps ($39.99 each) and six single dashboards ($86.94 together). None of the singles is inside the HR & Workforce bundle. There are no per-employee fees and no renewals.
Do I need Power BI Pro to use the Power BI HR dashboard?
No. Power BI Desktop is free, and you can open, edit and present the HR Dashboard in Power BI with it. You only need a paid Power BI licence if you want to publish the report to the Power BI service and share it online with colleagues who don’t have the file.
How do you calculate employee turnover rate?
Divide the number of employees who left during the period by the average headcount for the same period. If 18 people left in a year and average headcount was 240, annual turnover is 7.5%. Track voluntary turnover separately, because resignations are the part HR can actually influence.
Are the HR web apps hosted for me?
No. The two web apps are Google Apps Script templates that you deploy in your own Google account with the included guide, so your employee data stays in your Google Drive. Both product pages have a live demo, so you can try every page first.
Can I customise these HR templates?
Yes. Formulas, KPI names, targets, dropdown lists and charts are editable, and you own the files outright. Rename departments, locations and job levels, add your own KPIs and change the targets. Being editable was a selection rule for every template in this HR stack.
Get more HR templates
Run the people function from numbers, not from memory. The HR & Workforce Analytics Bundle packs ten HR templates for $89.99 (save $48.91). Or start with the HR Dashboard in Excel for $17.99. One-time payment, instant download, no subscription.
Watch demos of these dashboards on our NextGenTemplates YouTube channel, and see the metrics behind them in our HR KPIs guide.