The Wind Energy KPI Dashboard in Excel is a powerful tool designed for energy companies, renewable energy managers, and environmental analysts looking to track and optimize the performance of wind energy projects. This customizable dashboard allows you to monitor key performance indicators (KPIs) related to wind turbine efficiency, energy production, maintenance schedules, and operational costs, all in one place.
With real-time data tracking and visual insights, this dashboard helps you assess the performance of wind farms, identify areas for improvement, and make data-driven decisions that enhance energy production efficiency, reduce downtime, and maximize profitability.
Key Features of the Wind Energy KPI Dashboard in Excel
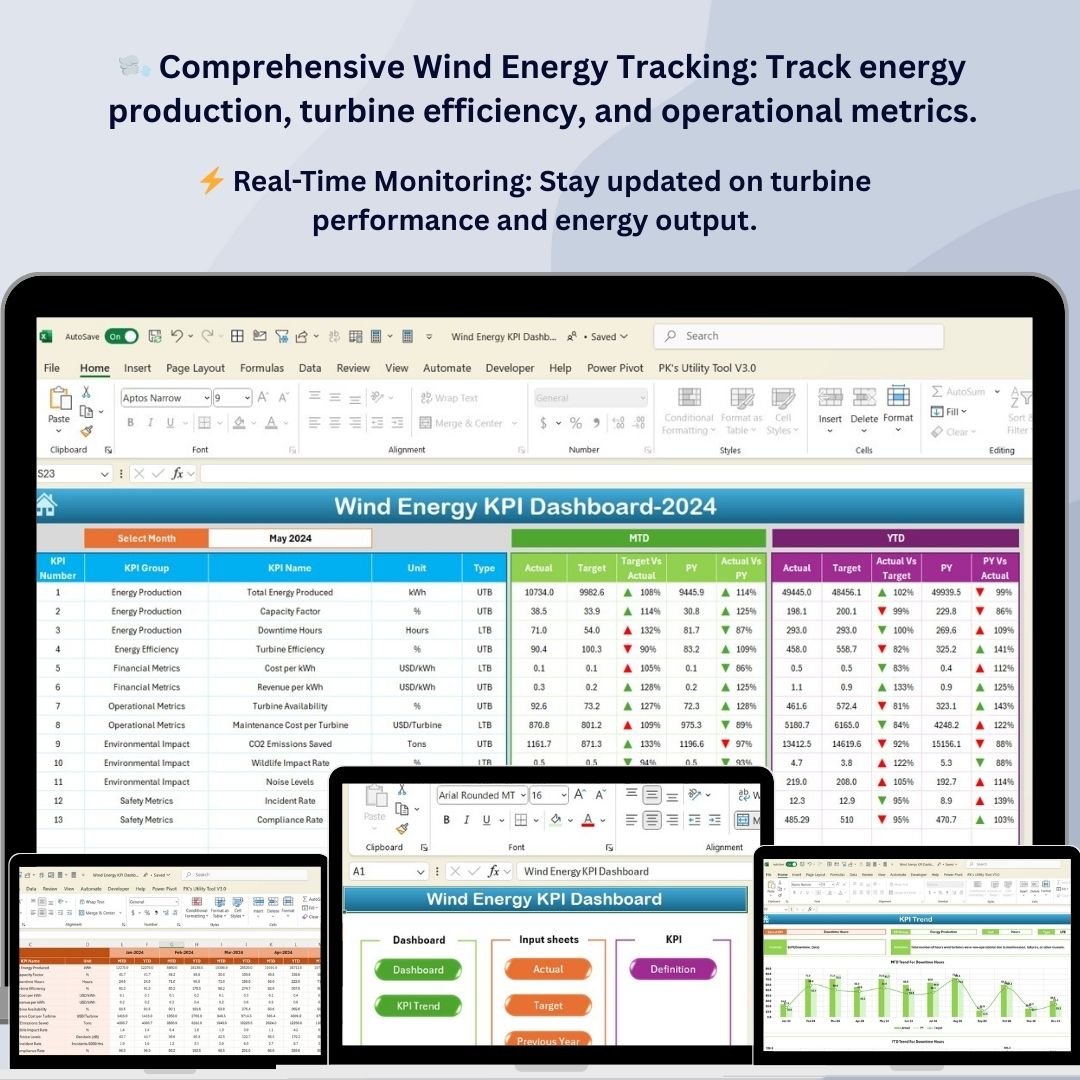
🌬️ Comprehensive Wind Energy Tracking
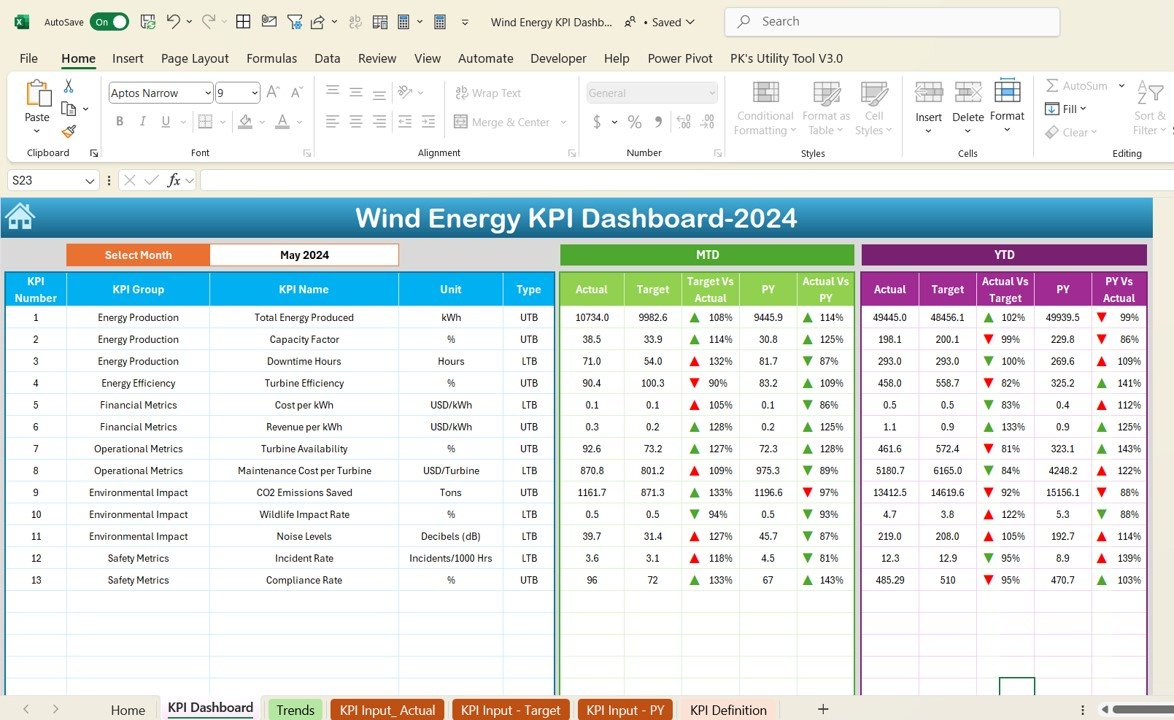
Track essential KPIs such as energy produced, turbine performance, downtime, maintenance costs, and operational efficiency. Monitor the health of each turbine and optimize energy production.
⚡ Real-Time Performance Monitoring
Stay updated on the performance of wind turbines in real-time, comparing actual output to targets and identifying any performance discrepancies for immediate resolution.
📈 Operational Insights
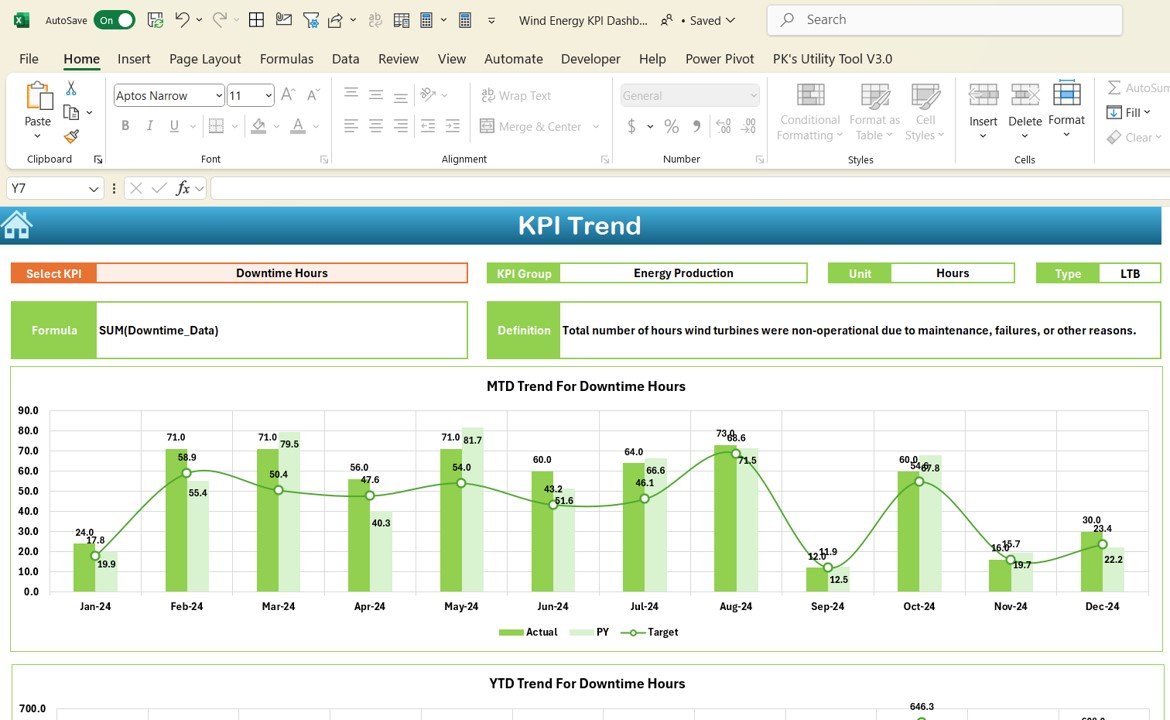
Visualize data related to energy production, downtime, maintenance schedules, and operational efficiency. Use these insights to improve turbine performance and reduce unplanned maintenance.
📅 Customizable KPIs for Wind Energy Operations
Easily tailor the dashboard to track KPIs specific to your wind energy project, whether it’s wind speed analysis, turbine wear, or production efficiency.
🖥️ Interactive & User-Friendly Interface
The Excel-based dashboard is designed for ease of use, with interactive features that allow you to track performance data, analyze trends, and visualize energy production through charts and graphs.
Why You’ll Love the Wind Energy KPI Dashboard in Excel
✅ Track Key Wind Energy Metrics
Monitor turbine efficiency, energy output, and maintenance schedules to ensure optimal performance and reduce downtime.
✅ Optimize Energy Production
Use real-time performance insights to make adjustments that maximize energy production and minimize operational disruptions.
✅ Improve Operational Efficiency
By visualizing operational data, you can identify underperforming turbines, reduce maintenance costs, and optimize energy production.
✅ Enhance Data-Driven Decision Making
Leverage insights from key KPIs to make informed decisions about energy production, equipment upgrades, and maintenance strategies.
✅ Visualize Trends & Performance
Interactive charts and graphs help you track performance trends, analyze operational data, and spot opportunities for improvement.
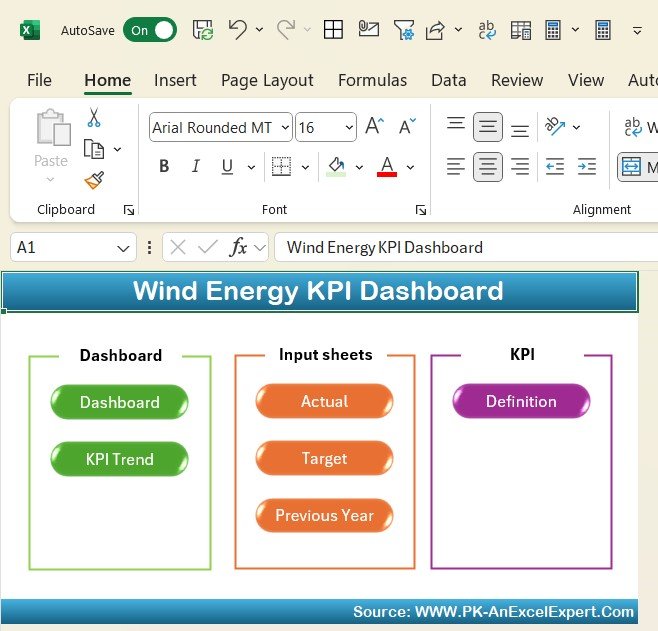
What’s Inside the Wind Energy KPI Dashboard Template?
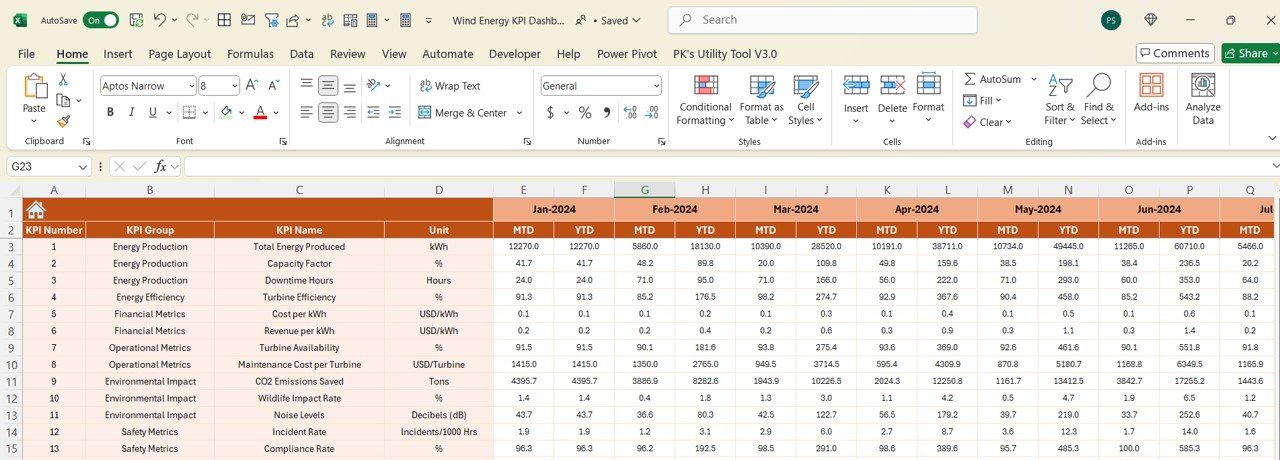
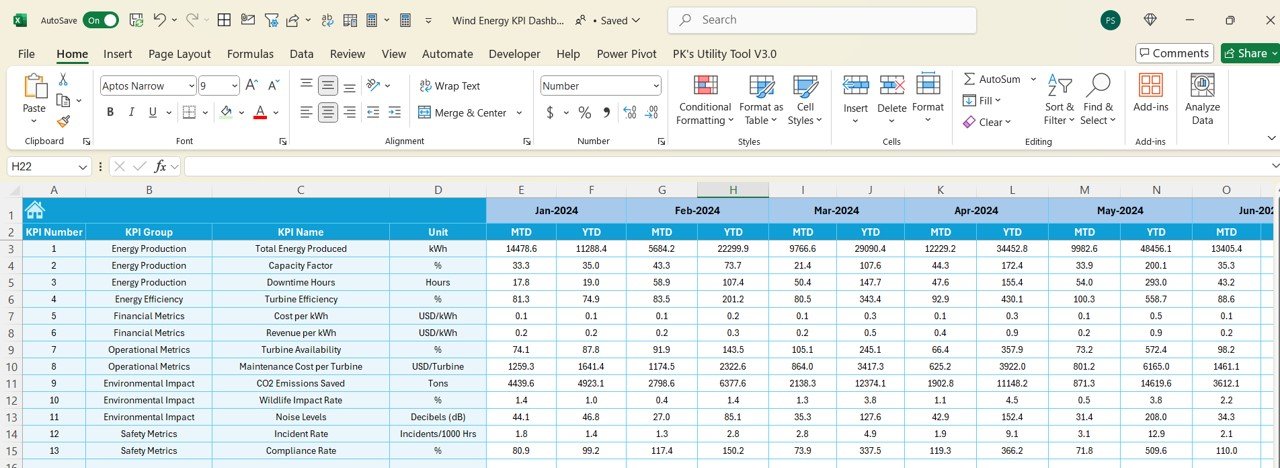
- Energy Production Monitoring: Track energy output, efficiency, and production rates.
- Turbine Performance Tracking: Monitor individual turbine performance and health indicators.
- Downtime & Maintenance Tracking: Track turbine downtime, maintenance schedules, and operational costs.
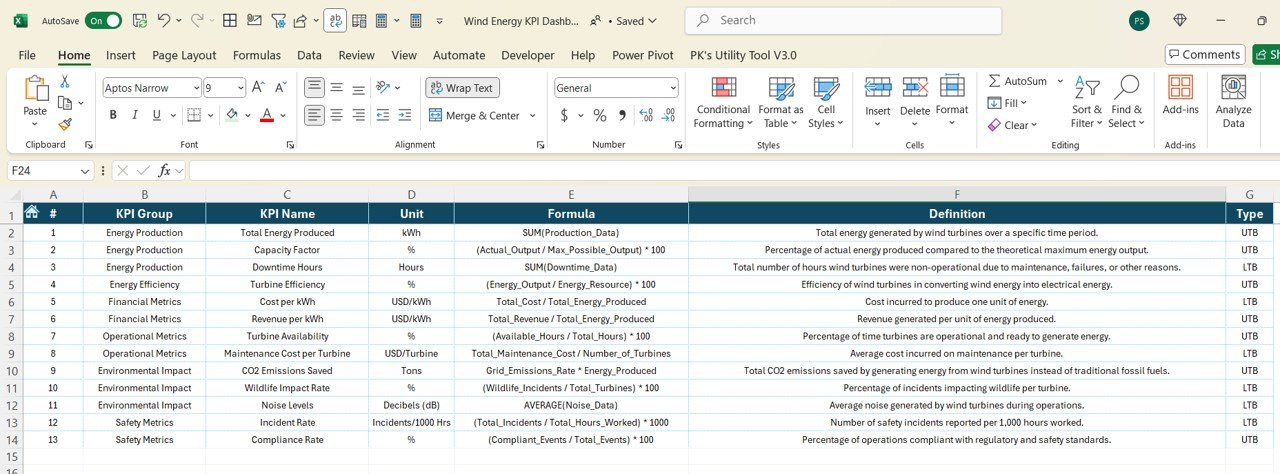
- Customizable KPIs: Adjust KPIs to match your specific wind energy project needs.
- Visual Insights: Use charts and graphs to visualize performance, energy production, and operational efficiency.
How to Use the Wind Energy KPI Dashboard in Excel
1️⃣ Download the Template: Get instant access to the Wind Energy KPI Dashboard.
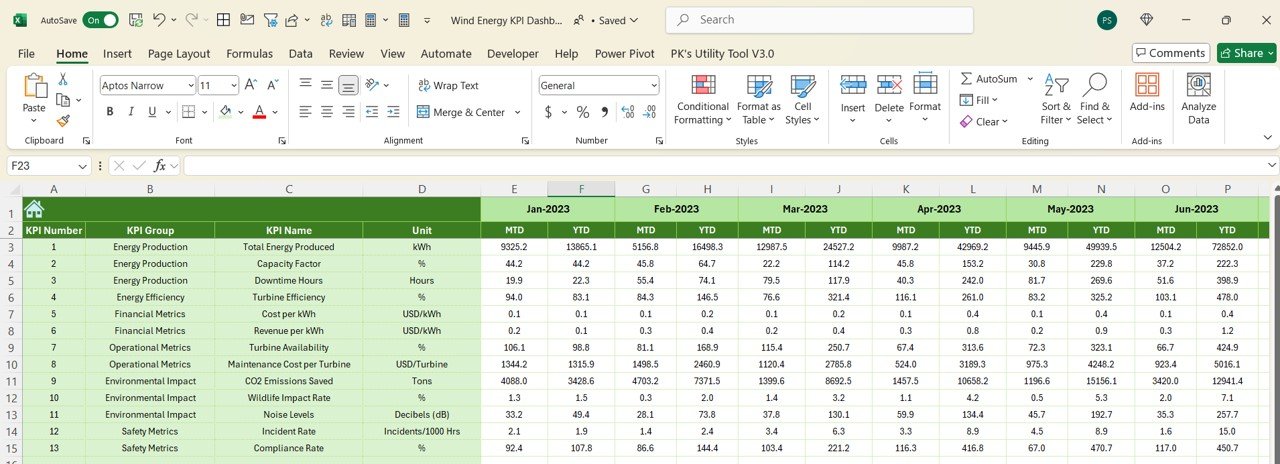
2️⃣ Enter Wind Energy Data: Input data such as turbine performance, energy output, and maintenance information.
3️⃣ Track KPIs: Use the dashboard to track turbine performance, energy production, and operational efficiency in real-time.
4️⃣ Analyze & Optimize: Use the insights to optimize energy production, reduce downtime, and improve turbine efficiency.
Who Can Benefit from the Wind Energy KPI Dashboard in Excel?
🔹 Wind Energy Operators & Managers
🔹 Renewable Energy Consultants
🔹 Energy Analysts & Environmental Researchers
🔹 Turbine Maintenance Teams
🔹 Investors & Stakeholders in Wind Energy Projects
🔹 Anyone Involved in Wind Farm Operations & Energy Production
Track, analyze, and optimize your wind energy operations with the Wind Energy KPI Dashboard in Excel. Monitor key performance metrics, improve turbine efficiency, and maximize energy production with this powerful and user-friendly tool.
Click here to read the Detailed blog post
Visit our YouTube channel to learn step-by-step video tutorials
Youtube.com/@PKAnExcelExpert


Reviews
There are no reviews yet.