

The Water Supply KPI Dashboard in Power BI is an essential tool for water utility companies, municipal water departments, and operations managers to track and optimize key performance indicators (KPIs) related to water supply management. Whether you’re overseeing water distribution, monitoring treatment facilities, or managing water consumption, this Power BI-based dashboard provides real-time insights into water usage, efficiency, financial performance, and infrastructure management.
With customizable features and interactive visuals, this dashboard allows you to monitor water production, track supply levels, optimize resource allocation, and ensure efficient service delivery to meet community demands.
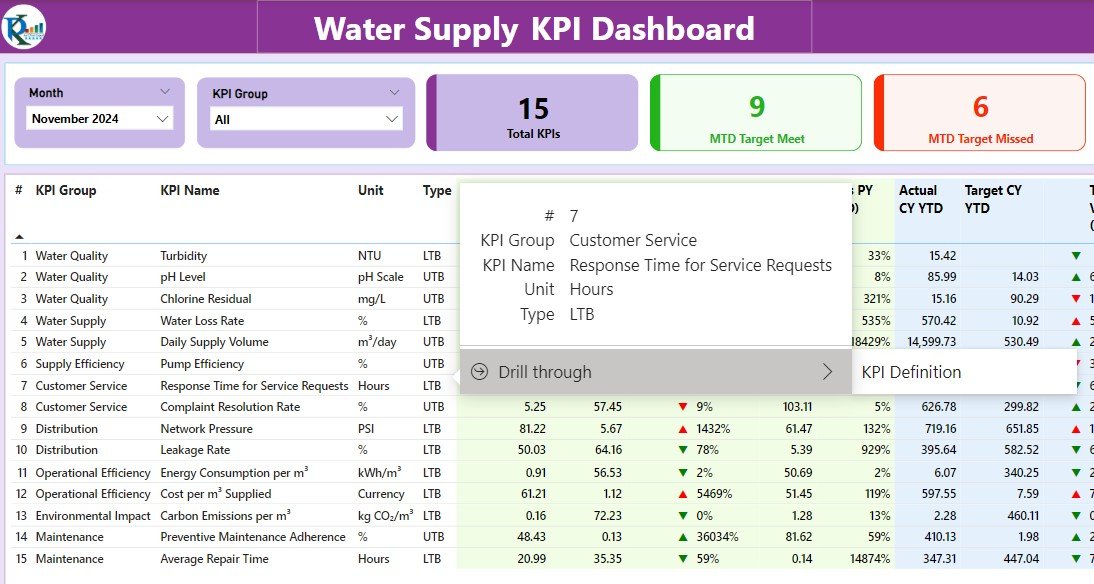
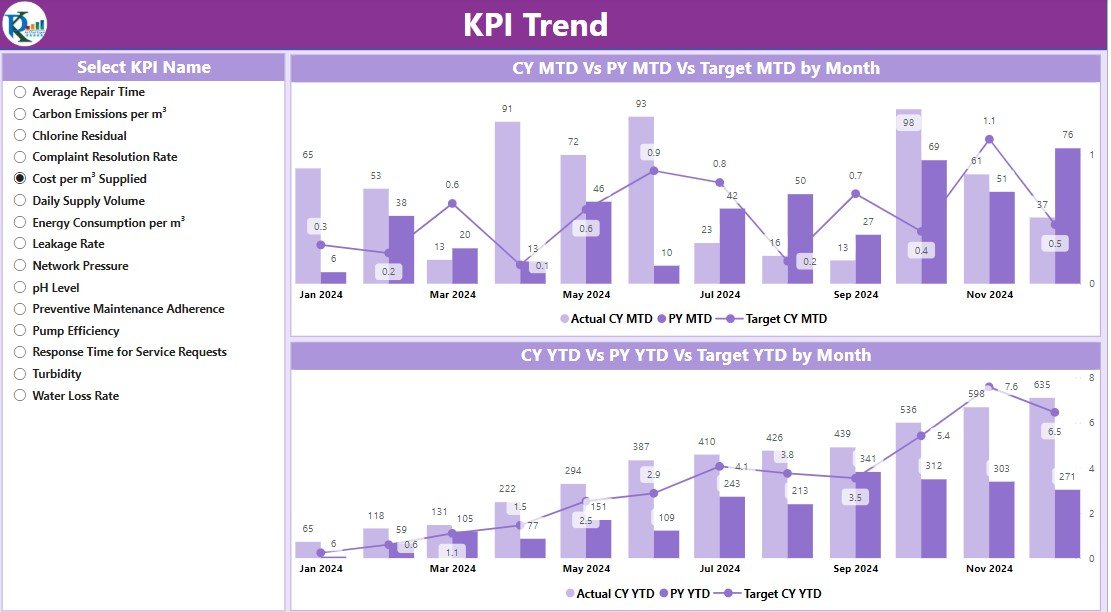
Key Features of the Water Supply KPI Dashboard in Power BI:
💧 Water Production and Distribution Tracking
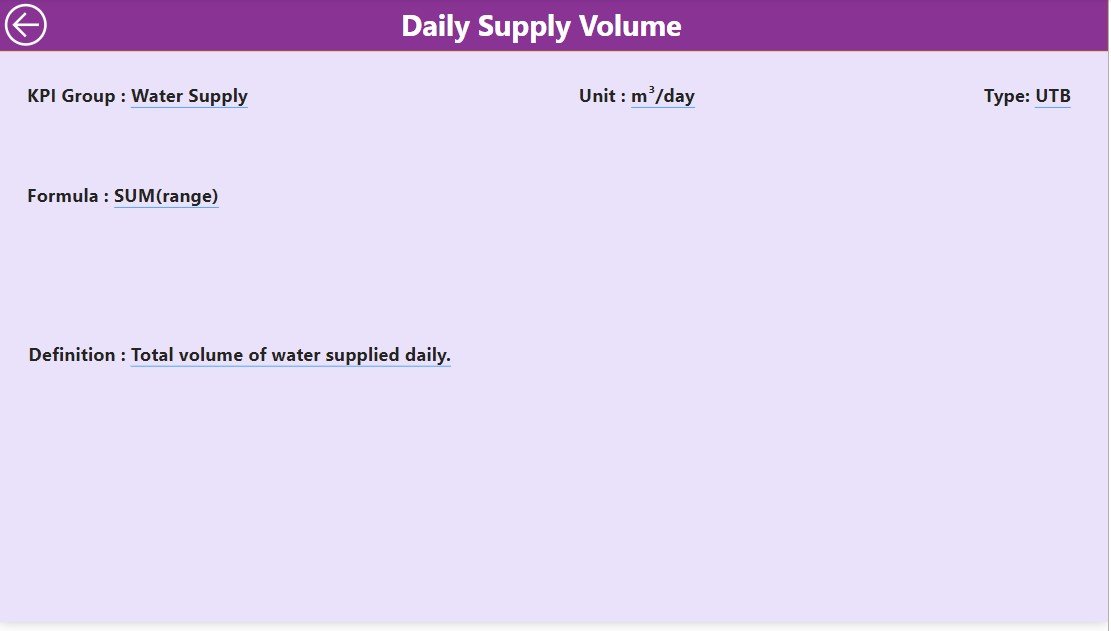
Monitor the total volume of water produced, distributed, and consumed in your service area, ensuring that supply meets demand and minimizing waste.
💰 Revenue and Cost Tracking
Track revenue from water sales and monitor operational costs including treatment, distribution, and maintenance, to assess profitability and cost efficiency.
📊 Water Loss and Efficiency Metrics
Track water loss due to leaks, wastage, or inefficiencies in the distribution system, and monitor the effectiveness of leak detection and reduction efforts.
🛠️ Infrastructure and Maintenance Monitoring
Monitor the condition of water infrastructure such as pipes, treatment plants, and pumps, including maintenance schedules, downtime, and repair needs.
🌍 Sustainability and Environmental Impact
Track sustainability metrics, such as water conservation, energy consumption in water treatment, and carbon footprint reduction efforts, to ensure environmentally friendly operations.
🚀 Why You’ll Love the Water Supply KPI Dashboard in Power BI:
✅ Monitor Water Production and Consumption – Track the volume of water produced and consumed to ensure that supply meets demand and operations are running efficiently.
✅ Evaluate Financial Performance – Track revenue and costs to ensure that water supply operations are financially sustainable and cost-efficient.
✅ Track Water Loss and Efficiency – Identify water losses and inefficiencies in the distribution network to optimize resource management and reduce waste.
✅ Manage Infrastructure and Maintenance – Monitor the performance and condition of water infrastructure, track maintenance schedules, and ensure timely repairs.
✅ Track Sustainability and Environmental Impact – Track sustainability metrics, including water conservation efforts, to minimize environmental impact and improve operational efficiency.
✅ Fully Customizable and Interactive – Tailor the dashboard to meet your water supply management needs with real-time, interactive data visualizations.
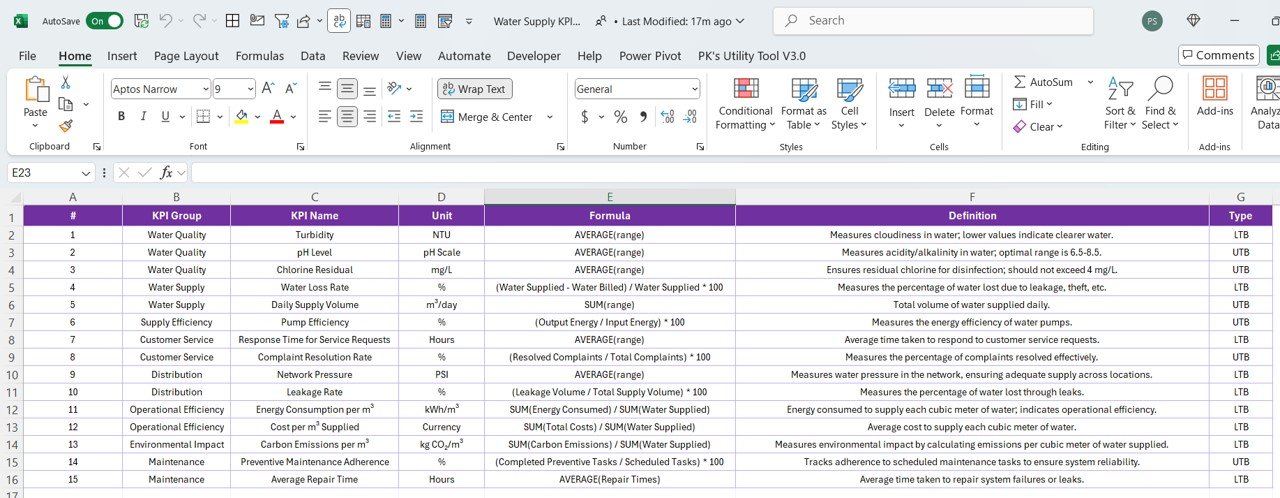
What’s Inside the Water Supply KPI Dashboard in Power BI:
-
Water Production and Distribution Tracking: Monitor the volume of water produced, distributed, and consumed across different regions or facilities to assess supply and demand.
-
Revenue and Cost Analysis: Track income from water sales and monitor operational and maintenance costs to ensure financial sustainability and identify cost-saving opportunities.
-
Water Loss and Efficiency Monitoring: Identify and analyze water loss due to leaks, inefficiencies, or wastage, and track the effectiveness of water-saving measures.
-
Infrastructure and Maintenance: Track the status of water infrastructure, including pipes, pumps, and treatment plants, monitor maintenance schedules, and plan repairs.
-
Sustainability Metrics: Track efforts to conserve water, reduce energy consumption, and lower carbon emissions in the water supply process.
-
Custom Reports: Generate custom reports summarizing key performance metrics, such as water production, revenue, efficiency, and infrastructure performance to make informed decisions.
How to Use the Water Supply KPI Dashboard in Power BI:
1️⃣ Download the Template – Instantly access your Power BI file upon purchase.
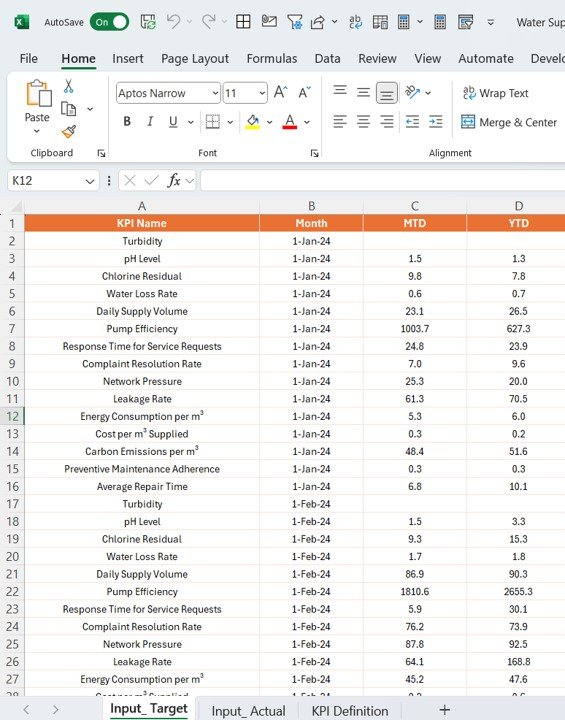
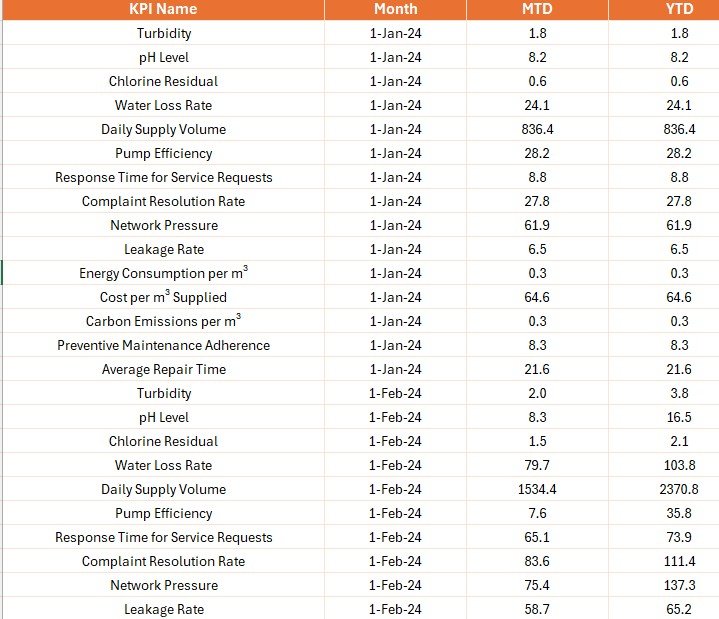
2️⃣ Input Data – Enter data on water production, distribution, costs, revenue, and infrastructure status to begin tracking key metrics.
3️⃣ Monitor Key Metrics – Use the dashboard to track water supply performance, financials, water loss, and sustainability metrics in real-time.
4️⃣ Evaluate Financials – Monitor revenue from water sales and track operational costs to ensure financial efficiency and sustainability.
5️⃣ Generate Reports – Create detailed reports summarizing water supply performance, revenue, water loss, and environmental impact to guide decision-making and improve operations.
Who Can Benefit from the Water Supply KPI Dashboard in Power BI:
-
Water Utility Companies
-
Municipal Water Authorities
-
Operations and Maintenance Managers
-
Financial Analysts in Water Supply
-
Infrastructure and Asset Managers
-
Environmental and Sustainability Teams
-
Water Treatment Plant Operators
-
Data Analysts in Water Supply
-
Government and Regulatory Bodies
The Water Supply KPI Dashboard in Power BI is the perfect tool for managing and optimizing water supply operations. By tracking key performance metrics such as water production, revenue, water loss, and sustainability efforts, this dashboard helps ensure that your operations run efficiently, sustainably, and profitably.
Click here to read the Detailed blog post
https://www.pk-anexcelexpert.com/water-supply-kpi-dashboard-in-power-bi/
Visit our YouTube channel to learn step-by-step video tutorials
Youtube.com/@PKAnExcelExpert


Reviews
There are no reviews yet.