The Water Production KPI Dashboard in Excel is an essential tool for water utilities and organizations looking to effectively monitor, manage, and improve their water production processes. This user-friendly and interactive dashboard provides a comprehensive view of critical Key Performance Indicators (KPIs) related to water production, enabling organizations to track performance, set targets, and make informed decisions that drive operational efficiency and sustainability.
By consolidating important metrics in one accessible place, the dashboard offers real-time insights into water production efficiency, resource utilization, and cost management. With clear visualizations and trend analysis, this dashboard helps organizations identify performance gaps and optimize their operations for better service delivery and resource conservation.

Key Features of the Water Production KPI Dashboard:
🗂️ Comprehensive Data Organization:
-
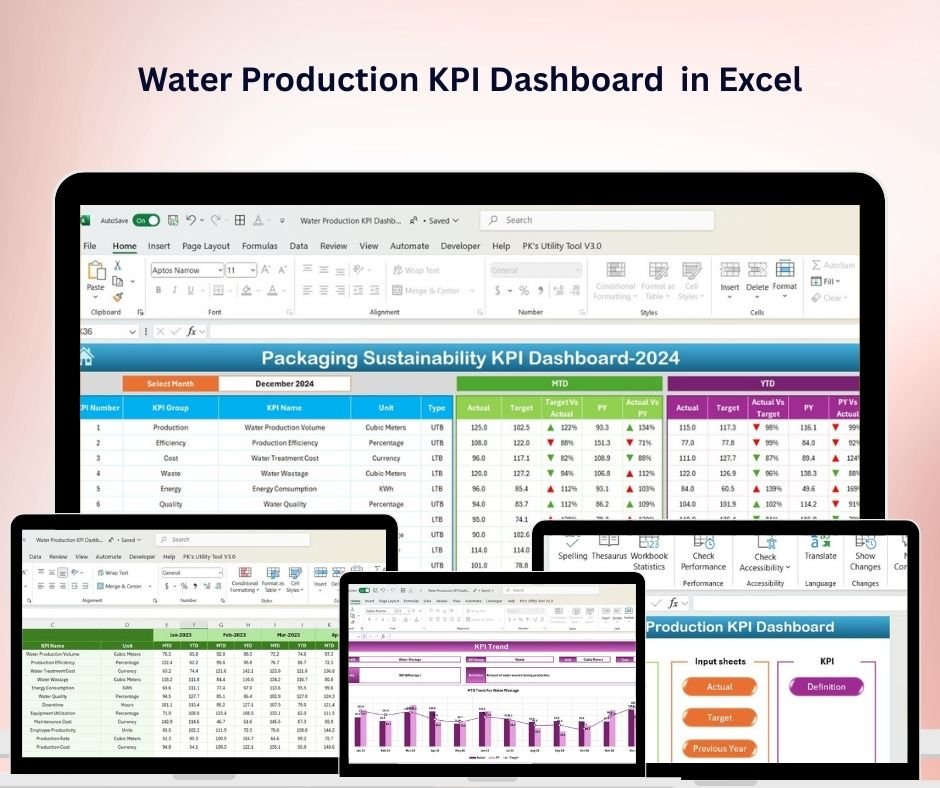
Home Sheet Tab: A centralized hub offering quick access to all sections of the dashboard, improving navigation and user experience.
-
Dashboard Sheet Tab: Displays key performance indicators (KPIs) for Month-to-Date (MTD) and Year-to-Date (YTD) actual versus target comparisons. Visual cues, such as up and down arrows, provide quick insights into performance status.
📈 Trend and Performance Analysis:
-
KPI Trend Sheet Tab: View historical trends for selected KPIs, including unit, type, formula, and detailed definitions. This helps to identify long-term performance patterns and areas for improvement.
📊 Customizable Data Tracking:
-
Actual Number Sheet Tab: Easily input and update MTD and YTD figures, with the ability to adjust the starting month to match your organization’s reporting cycle.
🎯 Target Setting and Benchmarking:
-
Target Sheet Tab: Set and track monthly and yearly targets for each KPI, ensuring that goals are clearly defined and performance is continually monitored against benchmarks.
📅 Year-over-Year Comparisons:
-
Previous Year Number Sheet Tab: Store and access historical data for year-over-year comparisons, allowing you to analyze trends and assess performance improvements or declines over time.
📖 Clear KPI Definitions:
-
KPI Definition Sheet Tab: Includes detailed definitions, units, formulas, and classifications for each KPI, ensuring consistent and accurate measurement across all users and stakeholders.
Benefits of Using the Water Production KPI Dashboard:
-
Improved Operational Efficiency: The dashboard centralizes all critical performance data, helping teams identify inefficiencies in the water production process and make adjustments to optimize resource usage.
-
Data-Driven Decision Making: With real-time data and clear visualizations, decision-makers can quickly assess operational performance and make informed decisions that align with organizational goals.
-
Enhanced Accountability and Transparency: By tracking and comparing actual performance against set targets, the dashboard promotes accountability at all levels of the organization, ensuring that everyone is working towards common goals.
-
Strategic Planning and Forecasting: Access to historical data and trend analysis provides valuable insights into future water production needs, helping planners make proactive adjustments to meet growing demand.
-
User-Friendly Interface: Designed with simplicity in mind, the dashboard can be used by anyone from data analysts to senior managers, regardless of their Excel proficiency.
How to Use the Water Production KPI Dashboard:
-
Download and Set Up:
Download the template and set it up in your Excel file. Begin by entering your organization’s water production data, including both actual and target figures. -
Input Actual Data:
Update the dashboard with actual performance numbers for MTD and YTD. This will automatically update the KPIs and performance visuals. -
Set Targets:
Enter your monthly and yearly targets for each KPI to track progress towards organizational goals. -
Monitor and Review Trends:
Use the KPI Trend Sheet to review performance over time and identify areas for improvement or potential risks in the water production process. -
Analyze and Optimize:
Leverage the insights provided by the dashboard to identify inefficiencies, improve operational processes, and align your resources with the most pressing needs of your water utility.
Who Can Benefit from This Water Production KPI Dashboard?
-
Water Utility Managers:
Oversee daily water production operations, ensuring that goals and regulatory requirements are met efficiently. -
Operational Analysts:
Track water production metrics to identify trends, analyze performance, and forecast future needs. -
Strategic Planners:
Use historical and real-time data to guide long-term planning and investment decisions in water infrastructure. -
Regulatory Compliance Officers:
Ensure that water production processes comply with local regulations and environmental standards.
By using the Water Production KPI Dashboard in Excel, water utilities can significantly improve their ability to manage operations, track performance, and make data-driven decisions that lead to better resource management, cost savings, and enhanced service delivery to communities.
click here to read detailed blog post
Visit our YouTube channel to learn step-by-step video tutorials












Reviews
There are no reviews yet.