


Running a vocational school requires balancing education quality, finances, and student success. Tracking tuition revenue, scholarships, satisfaction, and placements can be overwhelming — especially when managed manually. The Vocational Schools Dashboard in Excel 💡📈 simplifies it all by consolidating institutional data into one powerful, visual, and interactive platform.
This ready-to-use Excel dashboard provides school administrators, educators, and finance teams with real-time insights into academic, financial, and operational performance. From enrollment to placement outcomes, this template turns your data into actionable insights that drive better decisions and long-term success.
⚡ Key Features of Vocational Schools Dashboard in Excel
✅ Centralized Performance Tracking: Monitor tuition, scholarships, attendance, satisfaction, and placement in one visual dashboard.
✅ Interactive Page Navigator: Easily move between analytical pages for Finance, Program Analysis, Placement, Region, and Monthly Trends.
✅ Dynamic KPI Cards: View total tuition fees, total scholarships, net tuition, and attendance % instantly.
✅ Automated Charts & Visuals: Interactive visuals auto-update with every new data entry.
✅ MTD, YTD, and Trend Analysis: Analyze data month-by-month to identify progress or performance gaps.
✅ No Coding Required: Entirely formula-based — no macros or add-ins needed.
✅ 100% Customizable: Add new KPIs, programs, or campuses to match your institution’s structure.
✅ Multi-Campus Compatible: Includes regional analysis for comparing performance across locations.
✅ Perfect for All Users: Ideal for administrators, finance teams, and academic planners.
This Excel dashboard bridges the gap between data and decisions — giving every stakeholder a clear picture of what’s working and where to improve.
🧩 What’s Inside the Vocational Schools Dashboard in Excel
This powerful educational analytics template includes five core pages plus supporting data sheets for input and references:
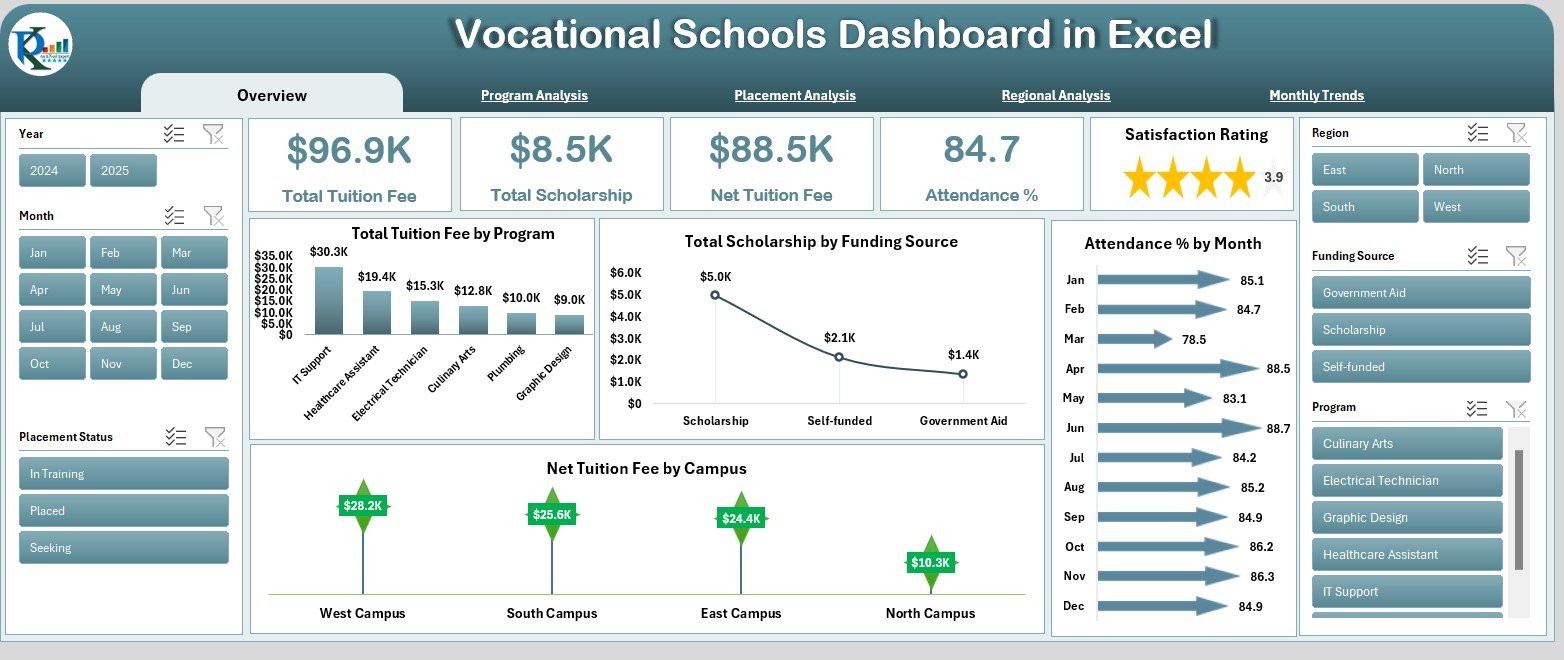
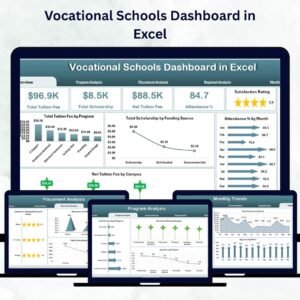
1️⃣ Overview Page — The Main Dashboard:
Your central command center.
Displays cards for key KPIs — Total Tuition Fee, Total Scholarships, Net Tuition Fee, and Attendance %.
Charts include:
-
Total Tuition Fee by Program
-
Total Scholarship by Funding Source
-
Net Tuition Fee by Campus
-
Attendance % by Month
2️⃣ Program Analysis Page — Academic Performance Insights:
Compare academic and financial performance across programs.
Visuals include:
-
Total Scholarship by Program
-
Satisfaction Rating by Program
-
Average Score by Program
3️⃣ Placement Analysis Page — Employment Outcomes:
Track how well students transition into careers.
Charts include:
-
Satisfaction Rating by Placement Status
-
Attendance % by Placement Status
-
Scholarship Distribution by Placement
4️⃣ Regional Analysis Page — Campus Comparison:
Evaluate financial and academic results across campuses or regions.
Charts include:
-
Total Tuition Fee by Region
-
Average Score by Region
-
Satisfaction Rating by Region
5️⃣ Monthly Trends Page — Performance Over Time:
See how institutional performance evolves each month.
Charts include:
-
Satisfaction Rating by Month
-
Total Tuition Fee by Month
-
Average Score by Month
Each sheet provides actionable insights — helping you identify opportunities, measure progress, and plan strategically.
🧠 How to Use the Vocational Schools Dashboard in Excel
🎓 Step 1: Input financial and academic data in the data sheets (tuition, scholarships, scores, attendance, etc.).
📊 Step 2: Refresh charts automatically — the dashboard updates instantly.
🎯 Step 3: Use the Page Navigator on the left to explore different performance views.
📈 Step 4: Review trends and variances using dynamic visuals and KPIs.
🧩 Step 5: Use insights to plan for upcoming terms, resource allocation, and quality improvement.
Within minutes, your institution will have a live performance dashboard ready for reviews and reporting.
👥 Who Can Benefit from This Vocational Schools Dashboard
🏫 School Administrators: Monitor overall institutional performance in real time.
💰 Finance Teams: Track tuition revenue, scholarships, and net income.
📚 Academic Departments: Evaluate student satisfaction, scores, and attendance.
🎓 Placement Officers: Analyze student employability and placement success.
🌍 Multi-Campus Directors: Compare performance across different regions.
This dashboard empowers every stakeholder — turning complex educational data into clear, visual insights.
🔗 Click here to read the Detailed Blog Post
🎥 Visit our YouTube channel to learn step-by-step video tutorials
👉 YouTube.com/@PKAnExcelExpert


Reviews
There are no reviews yet.