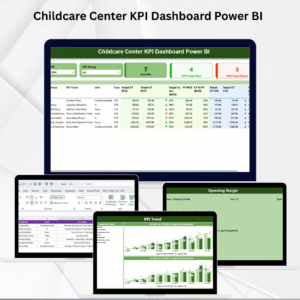
The used car market is booming, and dealerships are under constant pressure to stay profitable, competitive, and customer-focused. Managing this requires more than scattered spreadsheets or manual reports. That’s where the Used Car Sales KPI Dashboard in Power BI comes in — your all-in-one, interactive, and automated performance monitoring tool.
This ready-to-use dashboard converts raw sales, finance, and operational data into actionable insights. Whether you’re a dealership owner, sales manager, or analyst, this product helps you track every critical metric in real time, compare targets vs. actuals, and make informed business decisions.
Let’s dive into what makes this dashboard a must-have for your dealership.
🔑 Key Features of Used Car Sales KPI Dashboard in Power BI
-
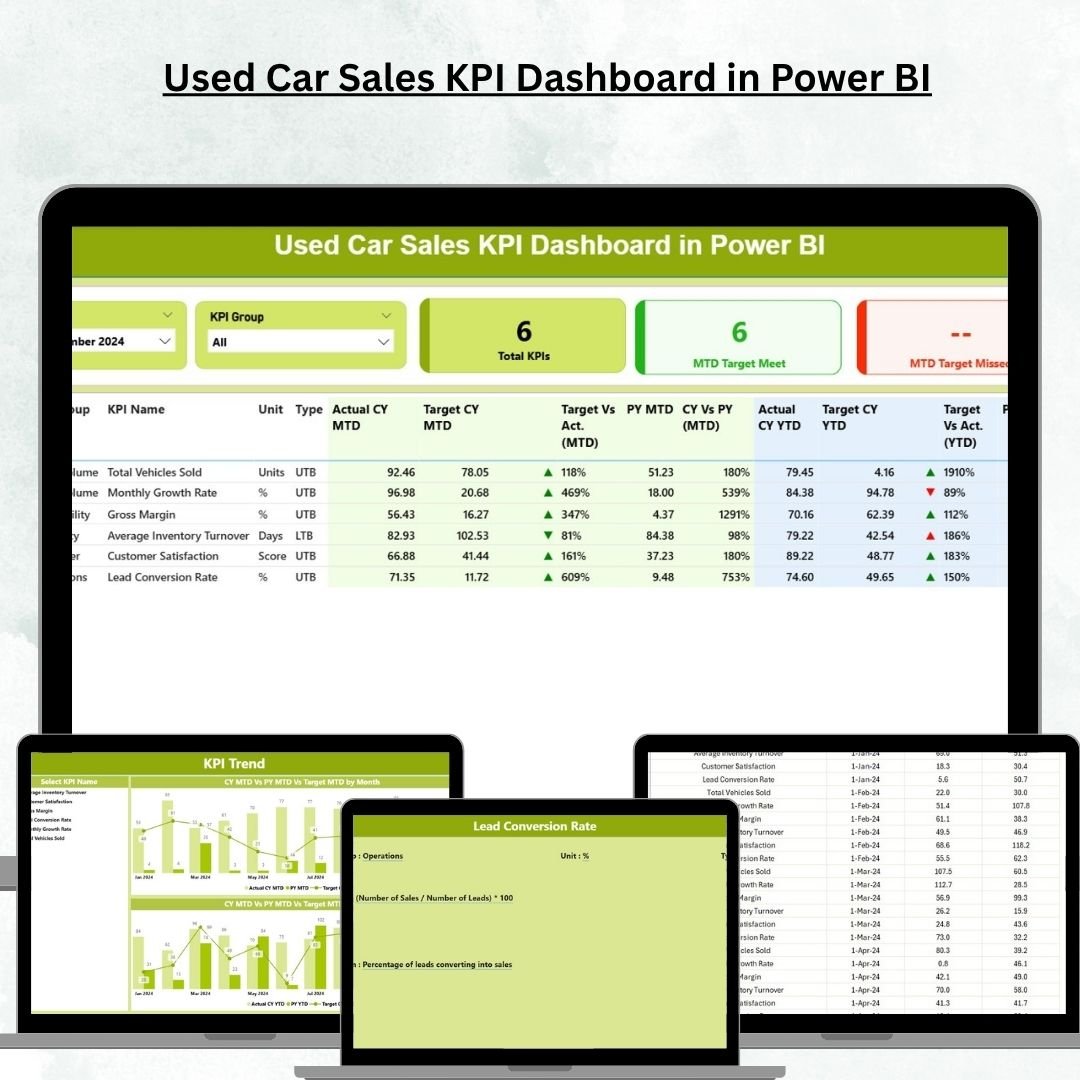
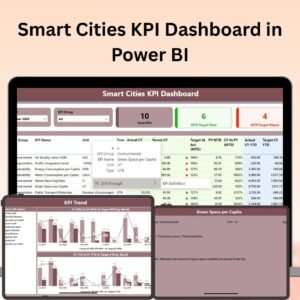
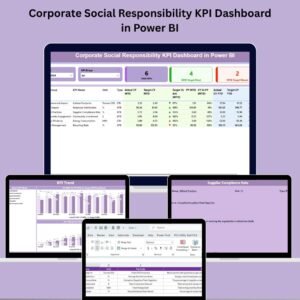
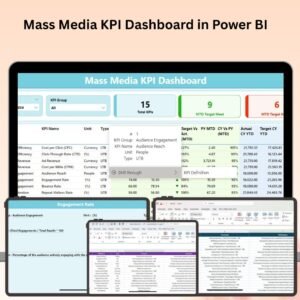
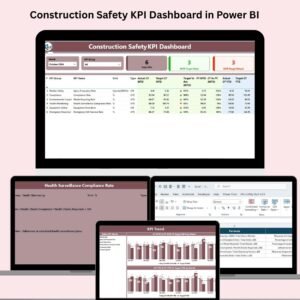
📊 3 Interactive Pages – Summary, KPI Trend, and KPI Definition pages for seamless navigation.
-
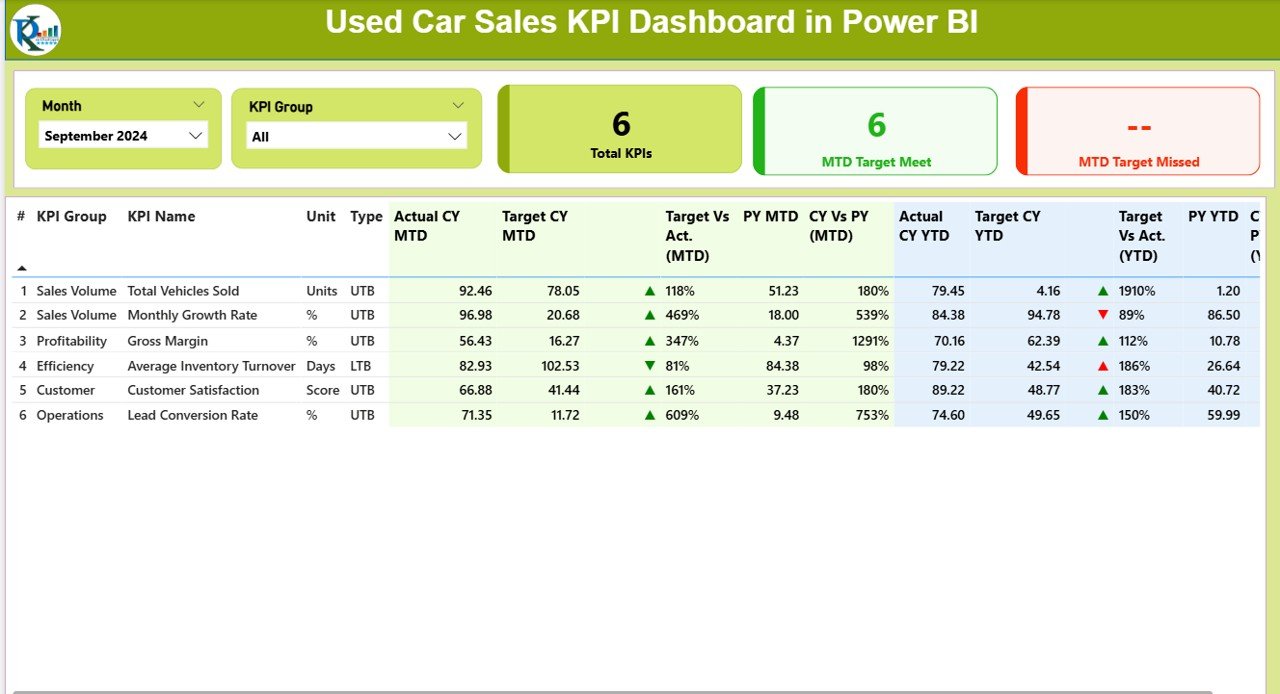
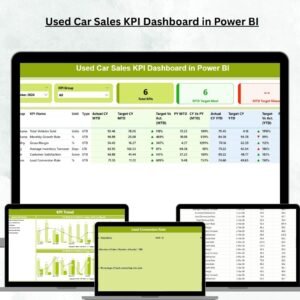
📌 Instant Performance Overview – KPI cards show Total KPIs, MTD Target Met, and MTD Target Missed.
-
🎯 Target vs Actual Analysis – Compare Month-to-Date (MTD) and Year-to-Date (YTD) results against set targets.
-
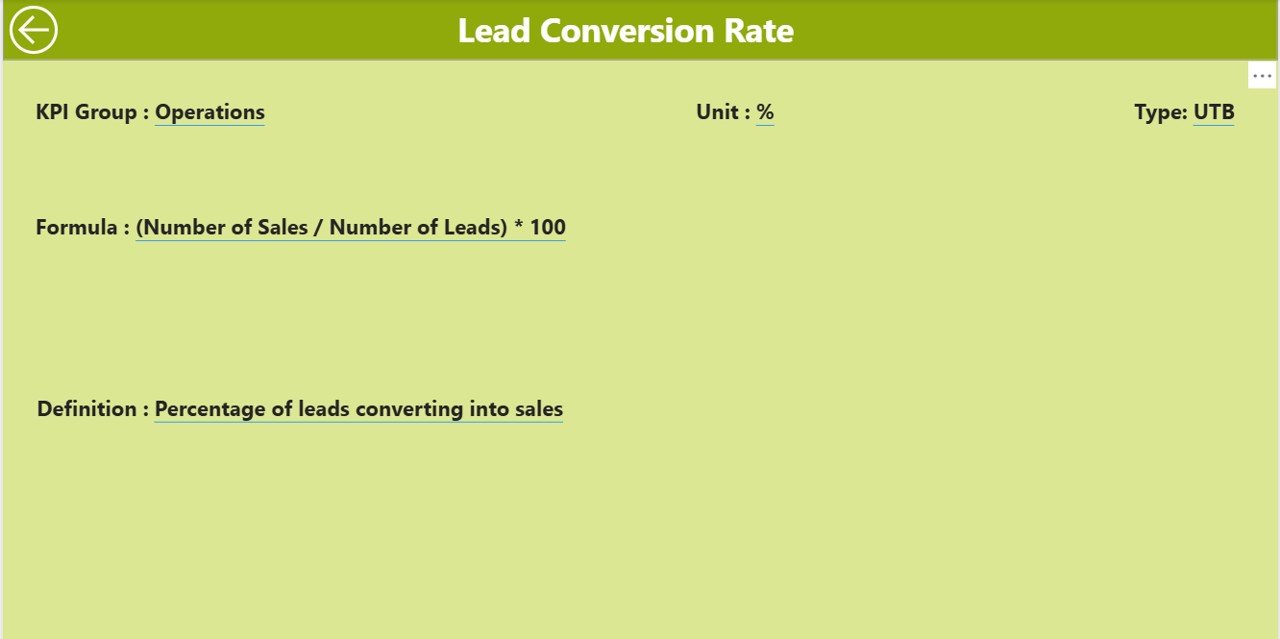
🔍 Drill-Through Functionality – Explore KPI definitions and formulas to ensure transparency.
-
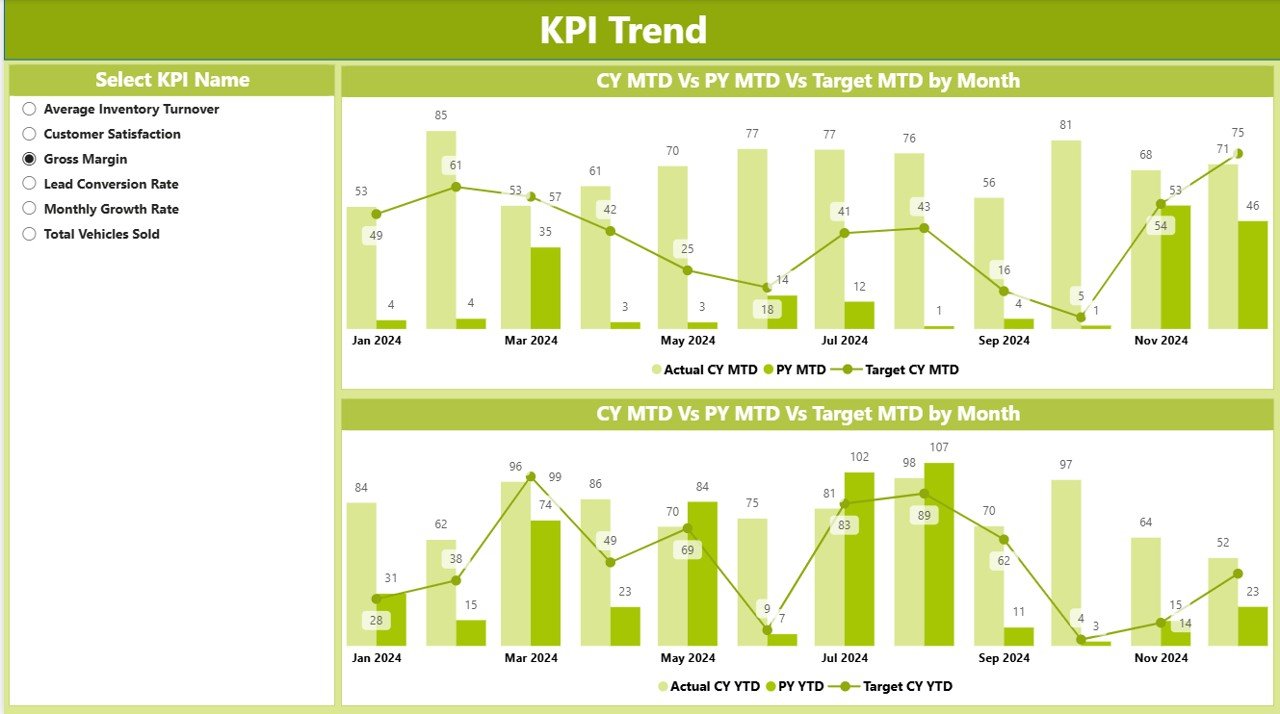
📈 Trend Analysis – Combo charts reveal actual vs. target vs. previous year performance.
-
🖥 Excel Integration – Easily update input sheets with actual and target values without altering visuals.
-
📱 User-Friendly – Slicers for months, KPI groups, and KPI names make filtering effortless.
-
✅ Customizable – Add, modify, or remove KPIs based on business needs.
📂 What’s Inside the Used Car Sales KPI Dashboard
This dashboard is structured into three core pages inside Power BI, all powered by an Excel dataset:
-
Summary Page
-
Month and KPI Group slicers for instant filtering.
-
Cards showing KPI counts and achievement status.
-
A detailed KPI table with fields like KPI Number, Group, Name, Unit, Type (UTB/LTB), Actual vs. Target, Previous Year comparisons, and achievement percentages.
-
-
KPI Trend Page
-
Interactive combo charts displaying Actual vs. Target vs. Previous Year.
-
KPI Name slicer to filter trends by individual metrics.
-
-
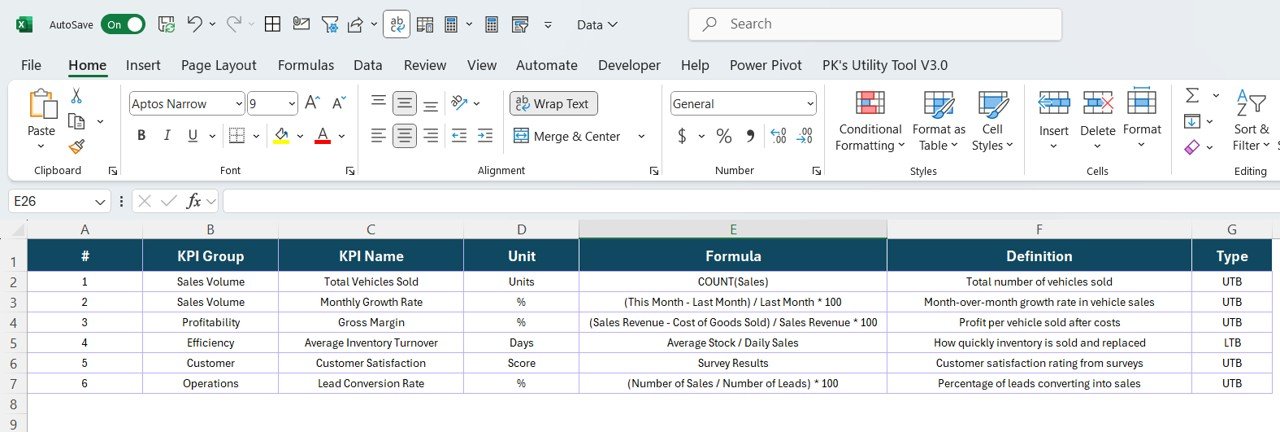
KPI Definition Page
-
Complete breakdown of KPI formulas and definitions.
-
Ensures that managers and employees are aligned on measurement standards.
-
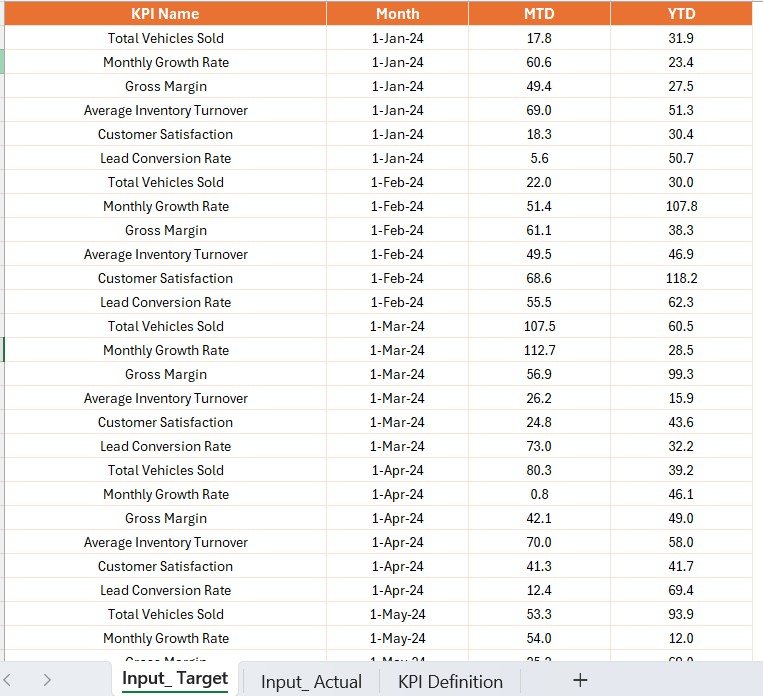
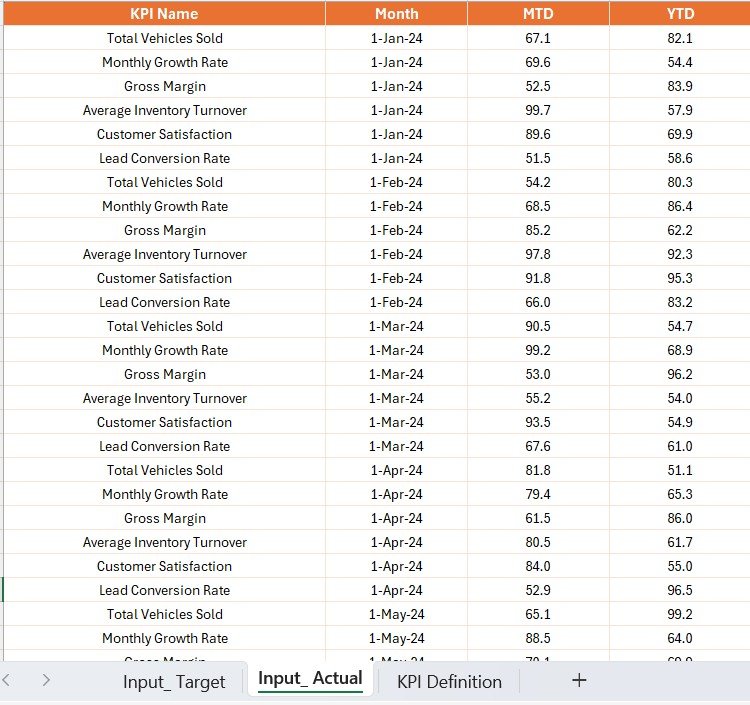
Excel Data Source
-
Input_Actual Sheet – Enter monthly performance numbers.
-
Input_Target Sheet – Record monthly targets for MTD and YTD.
-
KPI Definition Sheet – Define KPI structure, formulas, and calculation logic.
🛠 How to Use the Used Car Sales KPI Dashboard
-
Update Excel Sheets – Enter new values for KPIs in the input sheets each month.
-
Refresh Power BI – With one click, the dashboard updates automatically.
-
Navigate Pages – Use slicers and drill-through to explore insights in detail.
-
Track Trends – Monitor MTD and YTD growth against targets and previous year benchmarks.
-
Make Decisions – Identify areas needing urgent attention and allocate resources effectively.
👥 Who Can Benefit from This Used Car Sales KPI Dashboard?
-
🚗 Dealership Owners – Get a bird’s-eye view of total performance.
-
👨💼 Sales Managers – Identify top-performing sales reps and improvement areas.
-
💰 Finance Teams – Track approvals, margins, and revenue flow.
-
🛠 Operations Managers – Improve lead-to-sale conversions.
-
📢 Marketing Teams – Measure how campaigns influence sales growth.
✅ Why Choose This Dashboard?
Unlike static reports, this dashboard is interactive, automated, and visually clear. It saves time, reduces manual work, and delivers real-time insights. From year-over-year comparisons to target tracking, it equips your dealership with everything needed to scale profitability.
Click here to read the Detailed blog post
👉 Visit our YouTube channel to learn step-by-step video tutorials


Reviews
There are no reviews yet.