
The Upselling KPI Dashboard in Excel is a powerful tool designed to help businesses track, manage, and optimize their upselling efforts. Whether you’re in retail, e-commerce, or a service-based industry, this Excel-based dashboard provides valuable insights into your upselling strategies, helping you maximize revenue and enhance customer satisfaction.
With the ability to monitor key performance indicators (KPIs) such as total upsell revenue, conversion rates, and customer segments, this dashboard makes it easy to assess the success of your upselling initiatives. Track your sales team’s performance, identify high-value customers, and determine which upselling tactics are most effective to drive business growth.
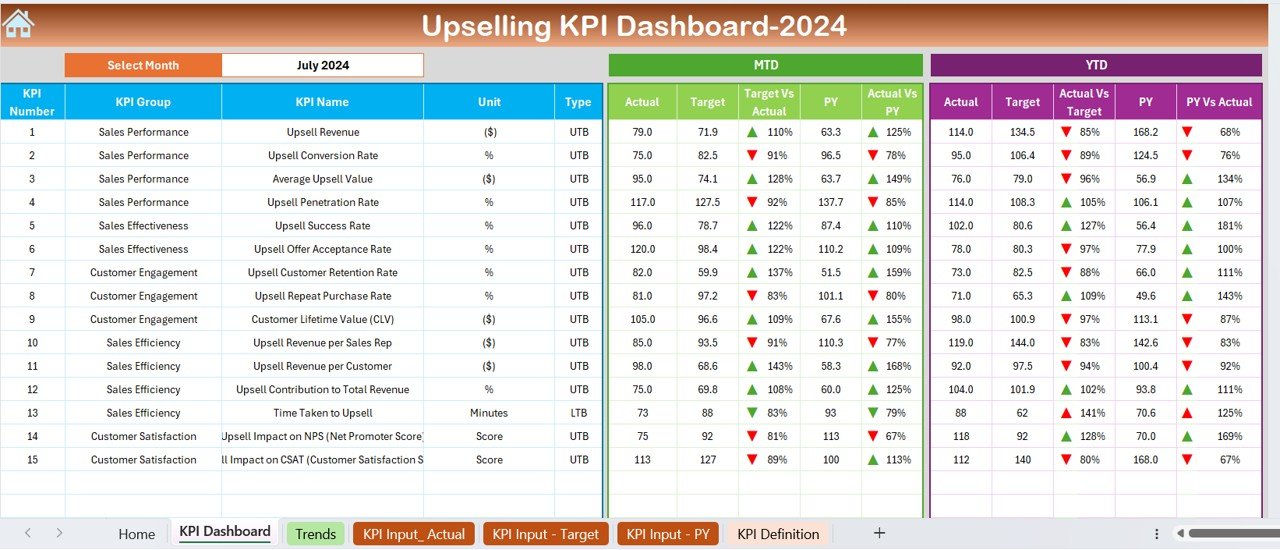
Key Features of the Upselling KPI Dashboard in Excel
📊 Total Upsell Revenue Tracking
Track the total revenue generated from upselling across various product categories, services, or customer segments. This metric is essential for measuring the financial impact of your upselling efforts.
📈 Conversion Rate Monitoring
Monitor upsell conversion rates to understand how well your sales team is converting prospects into higher-value purchases. Analyze the success of different upselling techniques and adjust your approach accordingly.
💡 Customer Segmentation Insights
Segment your customer base by various characteristics, such as purchase behavior, demographics, or sales interactions, to identify potential upselling opportunities and target the right customers with the right offers.
🔄 Sales Team Performance Analysis
Evaluate the performance of your sales team in terms of upselling success. Track individual team members’ progress, identify top performers, and provide coaching opportunities for those who may need additional training or resources.
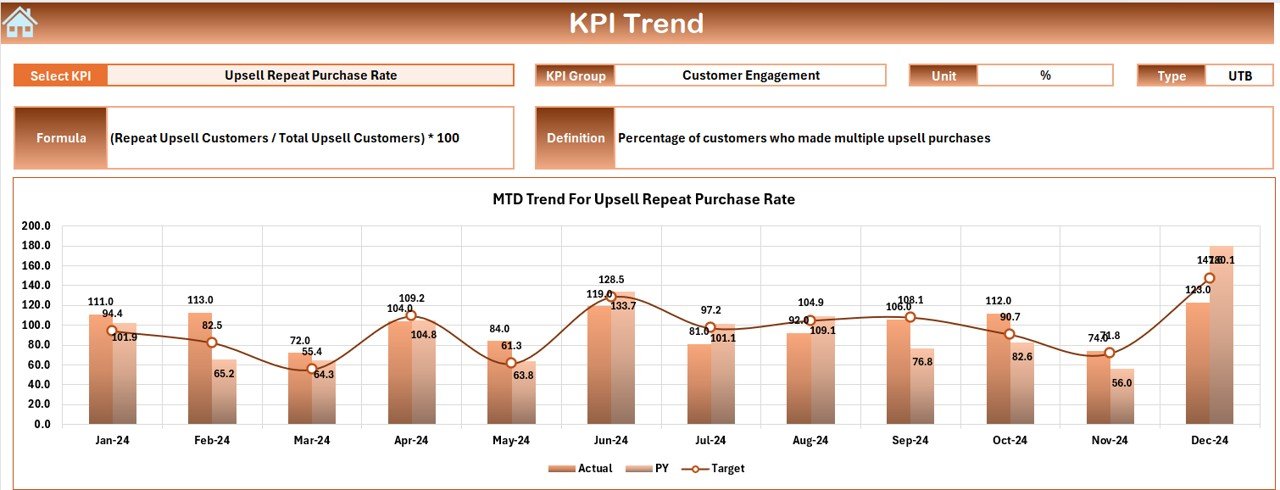
📅 Time-Based Tracking & Historical Data
Track upselling performance over time. Monitor monthly, quarterly, or yearly performance to identify trends, set realistic goals, and optimize your upselling strategies based on historical data.
⚙️ Customizable & Scalable Dashboard
Tailor the dashboard to fit your business’s unique needs. Add custom KPIs, adjust categories, and modify filters to track the most relevant data for your upselling strategy.
Why You’ll Love the Upselling KPI Dashboard in Excel

✅ Maximize Upsell Revenue
Track and optimize your upselling strategies to boost revenue and increase the average order value per customer.
✅ Enhance Customer Engagement
Monitor customer behavior and segment them to target specific groups with personalized upselling offers, increasing customer satisfaction and retention.
✅ Boost Sales Team Productivity
Evaluate the effectiveness of your sales team and empower them with insights to improve their upselling skills and performance.
✅ Data-Driven Decisions
Leverage real-time data to make informed decisions that enhance your upselling strategies, ensuring long-term success.
✅ Customizable & Easy to Use
The dashboard is easy to set up and customize to match your business requirements, making it ideal for businesses of all sizes.
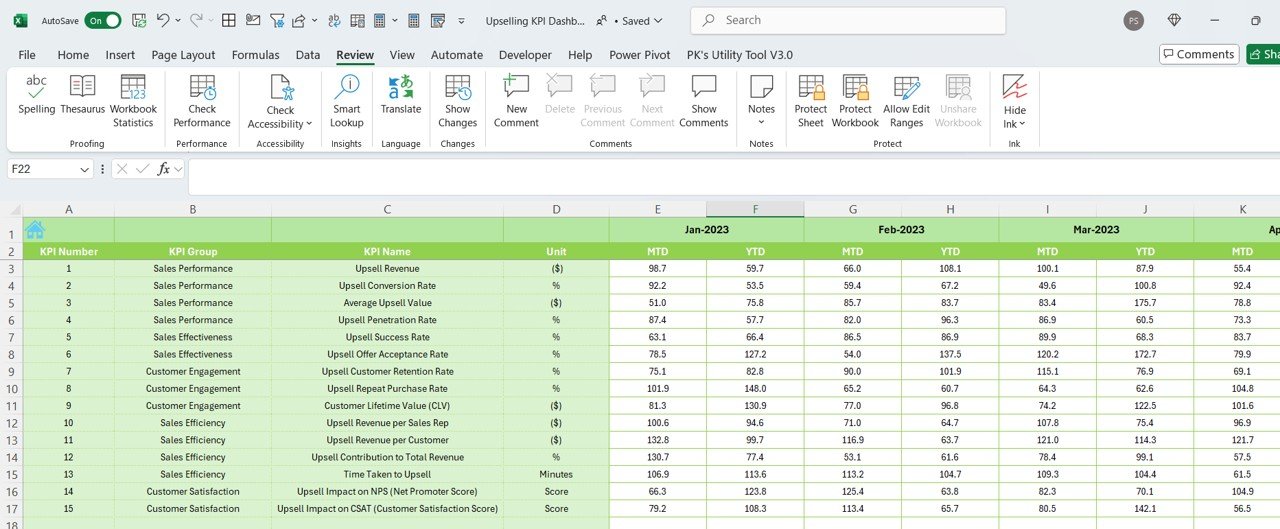
What’s Inside the Upselling KPI Dashboard in Excel?
-
Total Upsell Revenue: Track the total revenue generated from upselling efforts.
-
Conversion Rate Tracking: Monitor how well your upselling strategies are converting.
-
Customer Segmentation Insights: Segment your customer base to target the right audience.
-
Sales Team Performance Analysis: Assess your sales team’s upselling performance.
-
Time-Based Monitoring: Track upselling data over different periods for trend analysis.
-
Customizable KPIs: Modify the dashboard to match your upselling goals and objectives.
How to Use the Upselling KPI Dashboard in Excel
1️⃣ Download the Template: Access the Upselling KPI Dashboard in Excel instantly.
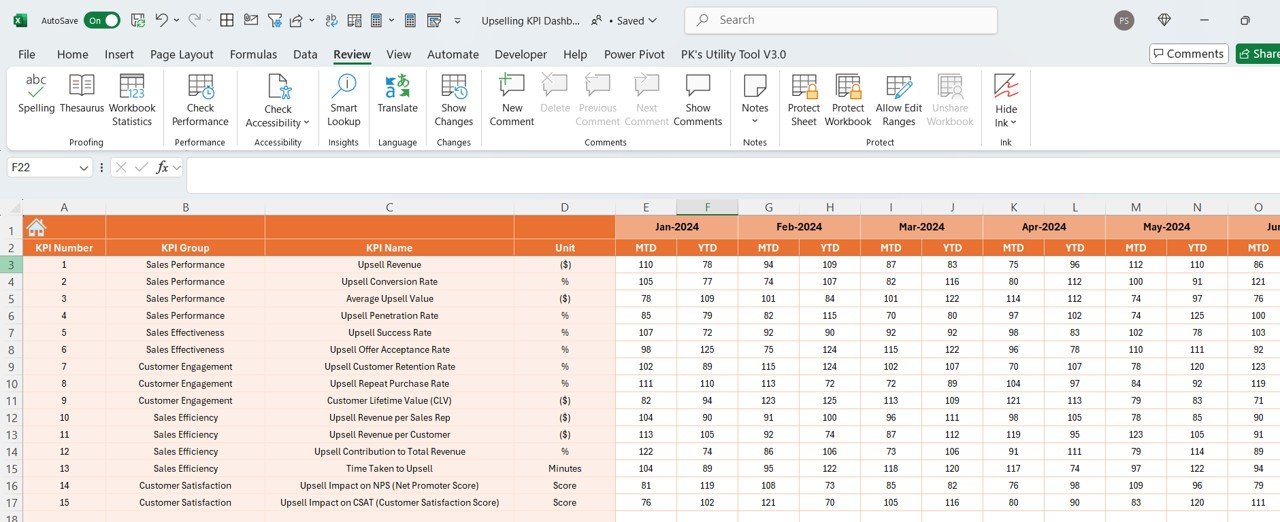
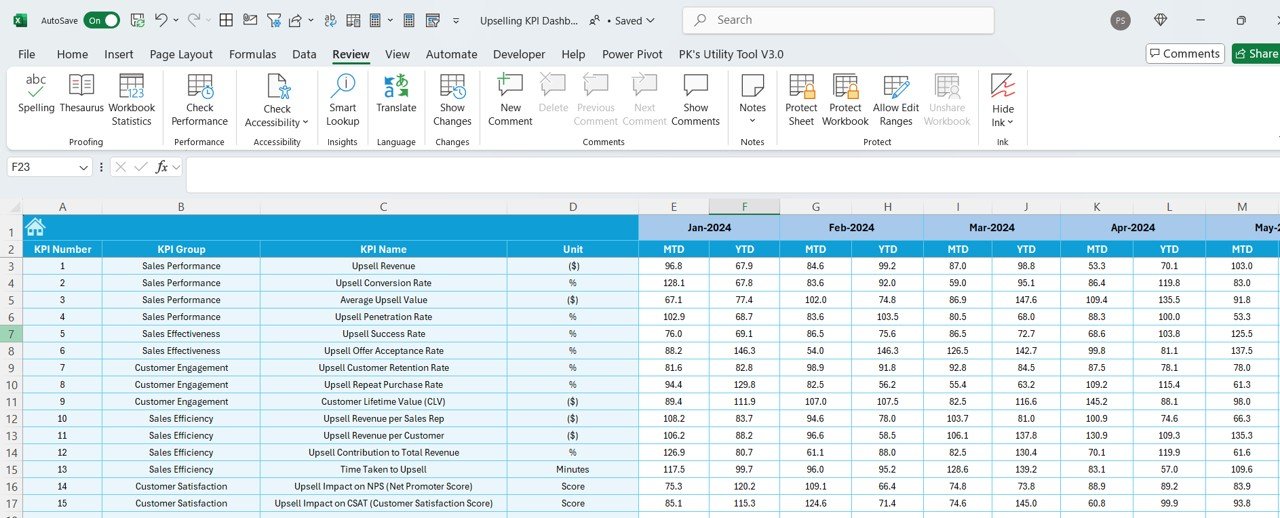
2️⃣ Integrate Your Sales Data: Import your sales data to monitor upselling metrics and track performance.
3️⃣ Track KPIs & Metrics: Monitor upsell revenue, conversion rates, and sales team performance.
4️⃣ Analyze Customer Segments: Use segmentation to identify and target potential upsell opportunities.
5️⃣ Optimize Your Upselling Strategy: Use insights to refine your upselling tactics and increase revenue.
Who Can Benefit from the Upselling KPI Dashboard in Excel?
🔹 Sales Teams & Managers
🔹 E-commerce Platforms & Online Retailers
🔹 Retail Store Managers
🔹 Business Owners & Entrepreneurs
🔹 Marketing & Customer Success Teams
🔹 Organizations with Sales-Centric Goals
Maximize the value of your customer interactions and increase your bottom line with the Upselling KPI Dashboard in Excel. Track key upselling metrics, optimize sales team performance, and boost your revenue potential all in one place.
Click here to read the Detailed blog post
Visit our YouTube channel to learn step-by-step video tutorials
Youtube.com/@PKAnExcelExpert


Reviews
There are no reviews yet.