Running a theme park isn’t just about thrilling rides and funnel cakes—it’s about smart operations, satisfied guests, and achieving business goals. That’s where the Theme Park KPI Dashboard in Power BI steps in. 🏰📊
This interactive and easy-to-use business intelligence tool puts your most critical KPIs in one place—from ticket sales and ride uptime to guest satisfaction and food performance. Whether you’re a park manager or department lead, you’ll gain the real-time insights needed to make smarter decisions and deliver an unforgettable experience.
🔑 Key Features of Theme Park KPI Dashboard in Power BI
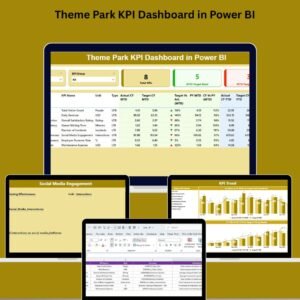
🧭 Summary Page – All KPIs, One View
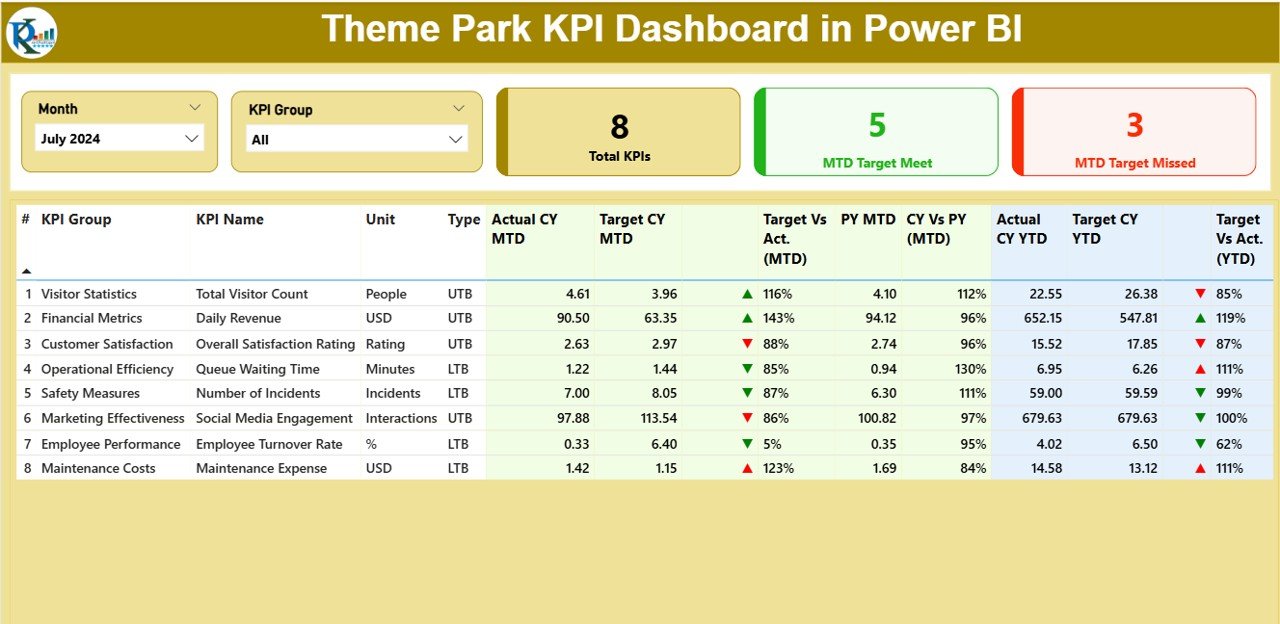
Track MTD and YTD performance using:
-
Total KPI Count
-
MTD Target Met
-
MTD Target Missed
Use Month and KPI Group slicers to filter the dashboard by time and category.
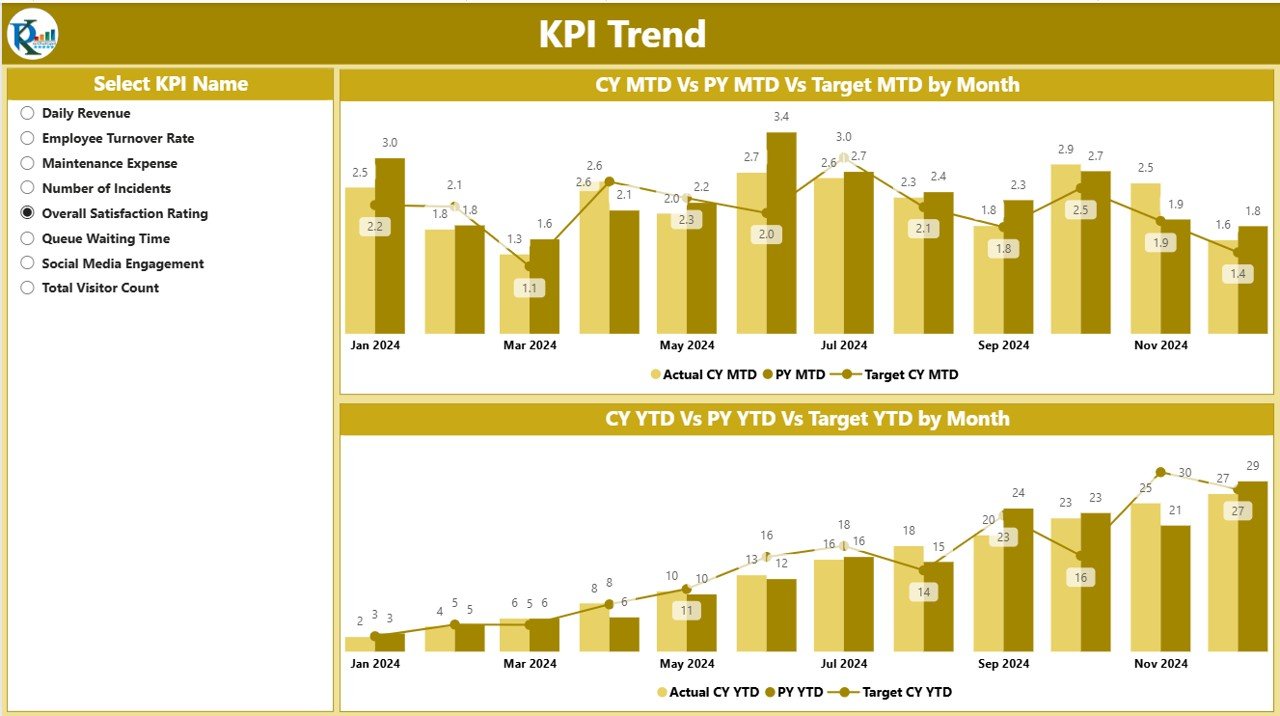
📊 KPI Trend Page – Visualize Progress
See performance over time through:
-
MTD & YTD combo charts (Current Year, Previous Year, Target)
-
KPI Selector Slicer for focused analysis
Identify dips, spikes, and patterns—spot issues before they escalate.
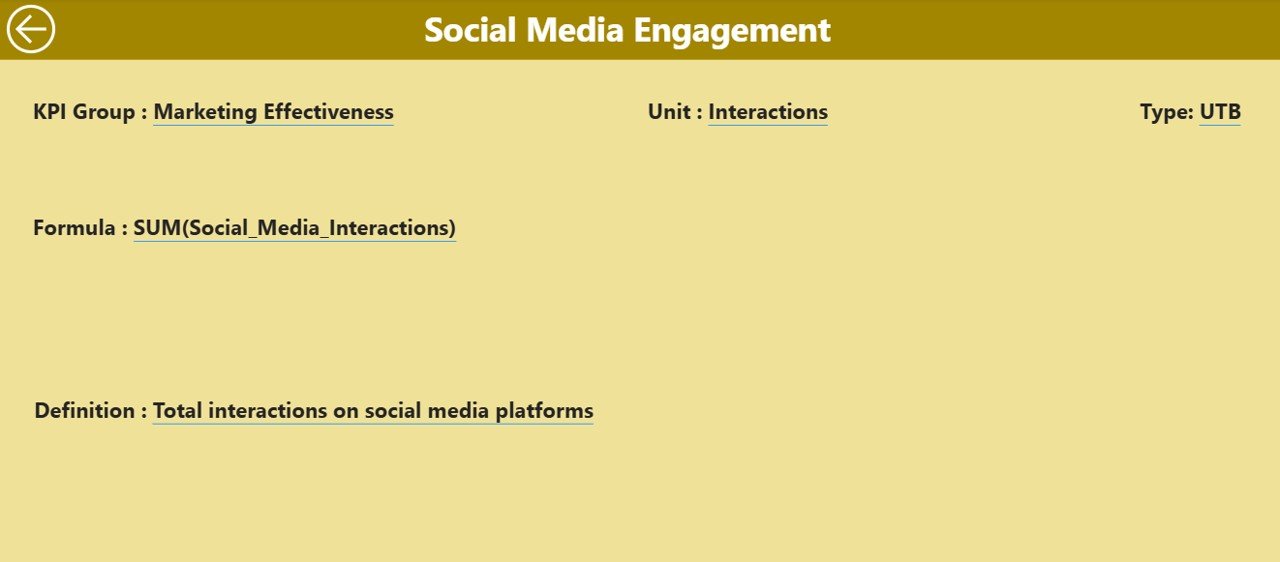
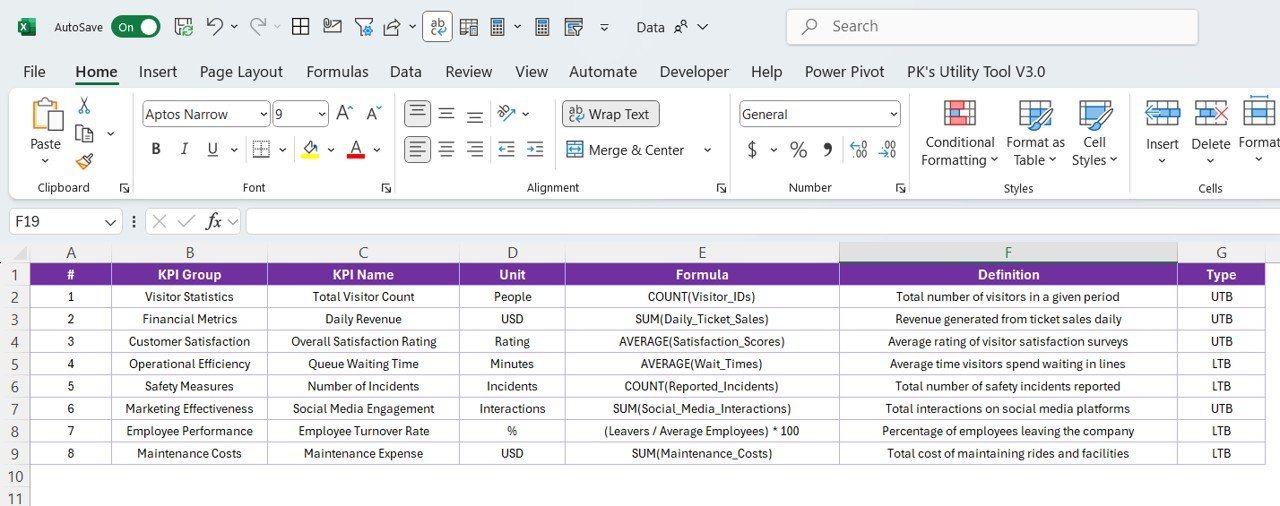
🔍 KPI Definition Page – Drill Down on Metrics
Right-click any KPI on the summary table to access:
-
KPI Number, Name, Group
-
Unit, Formula, Type (LTB/UTB)
-
Definition and Logic
Use the Back Button to return seamlessly.
📦 What’s Inside the Theme Park KPI Dashboard
📁 Power BI (.pbix) File
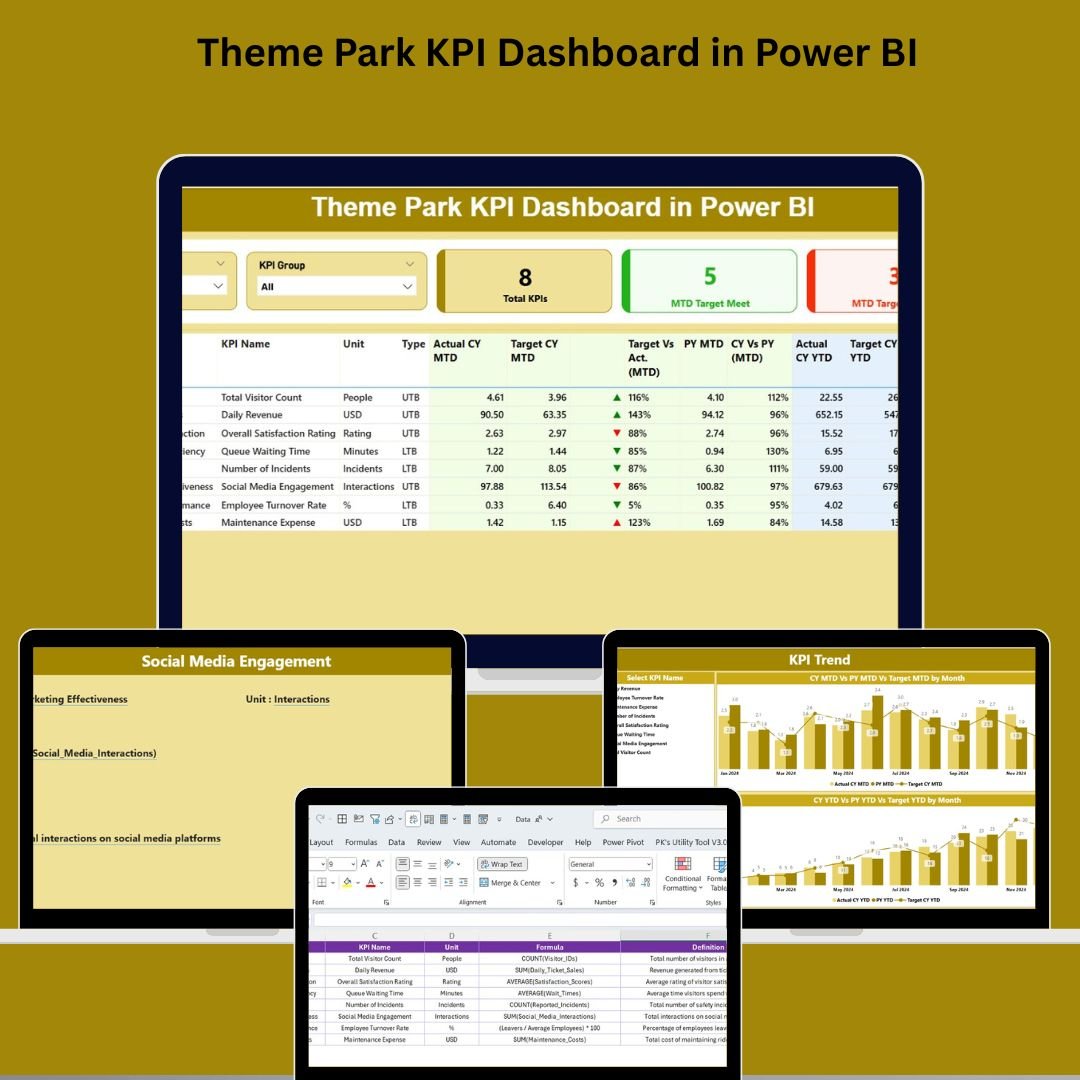
📊 3 Pages – Summary, KPI Trend, KPI Definition
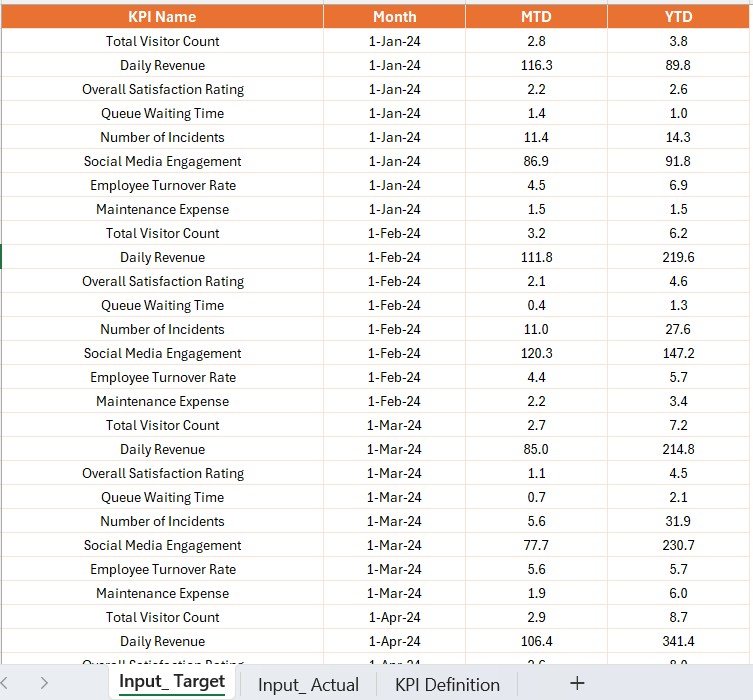
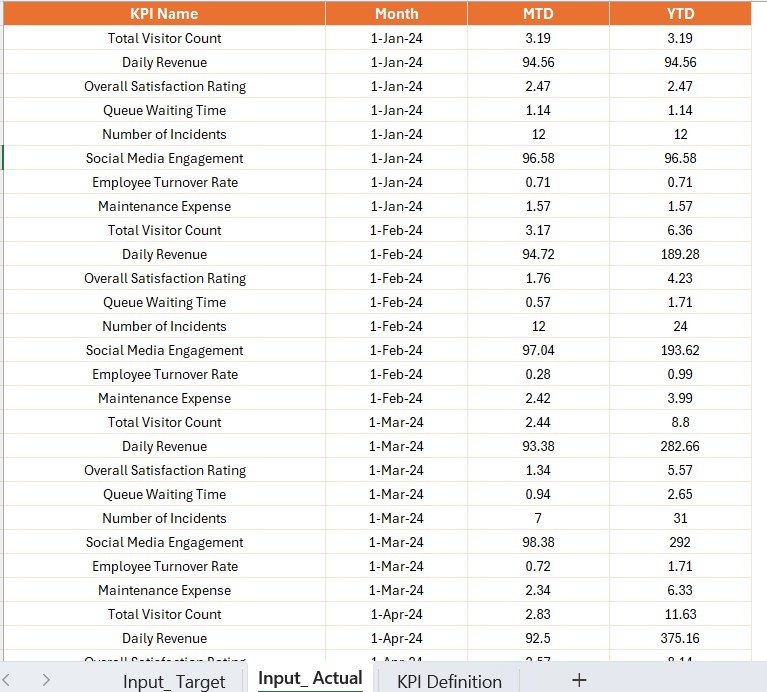
📘 Excel Data Source with 3 structured sheets:
-
Input_Actual (MTD, YTD values by month)
-
Input_Target (Monthly KPI targets)
-
KPI Definition (Metadata, formula, unit, KPI type)
🔄 Auto-Refresh when Excel data is updated
🔍 Slicers to drill down by month, category, or KPI
🔁 LTB/UTB Indicators – Visual arrow icons for quick understanding
🧩 Customizable for any park size or department structure
🛠️ How to Use the Theme Park KPI Dashboard
1️⃣ Download the Power BI and Excel files
2️⃣ Open Excel and input:
-
Actual performance data (Input_Actual)
-
Target values (Input_Target)
-
KPI definitions (KPI Definition)
3️⃣ Open Power BI and connect it to the Excel source
4️⃣ Click “Refresh” to update visuals
5️⃣ Filter by KPI, month, or group
6️⃣ Use the Drillthrough Page to review any KPI’s full logic
7️⃣ Publish to Power BI Service or share via Desktop
💡 All updates are Excel-based—no advanced skills needed!
🎯 Who Can Benefit from This Dashboard?
-
🏰 Theme Park Managers – Monitor performance in real-time
-
💸 Finance Teams – Track revenue, cost, and ROI
-
🛠️ Maintenance Teams – Analyze ride uptime and incidents
-
🍟 F&B Teams – Review food, beverage, and merchandise KPIs
-
👥 HR & Staffing – Track headcount, shift coverage, and overtime
-
💬 Guest Services – Monitor satisfaction and feedback trends
-
📣 Marketing Teams – Evaluate campaign effectiveness and visitor spikes
🔗 Click here to read the Detailed blog post
🎥 Visit our YouTube channel to learn step-by-step video tutorials
(YouTube.com/@PKAnExcelExpert)












Reviews
There are no reviews yet.