


The Theme Park KPI Dashboard in Excel is a powerful and user-friendly tool designed to help theme park managers and operators track, analyze, and optimize key performance indicators (KPIs) that are critical to running a successful park. From visitor attendance to ride efficiency, customer satisfaction, and revenue generation, this Excel-based dashboard allows you to get a comprehensive overview of your theme park’s performance.
With real-time data analysis and interactive reporting, this dashboard empowers you to make data-driven decisions that improve operational efficiency, enhance customer experience, and increase profitability. Whether you’re managing a small park or a large-scale amusement facility, the Theme Park KPI Dashboard is an essential tool for effective park management.

Key Features of the Theme Park KPI Dashboard in Excel
🎢 Visitor Attendance & Engagement Tracking
Track the number of visitors entering the park, categorize them by demographics, and monitor daily, weekly, and monthly attendance trends. Understand visitor engagement and behavior patterns to enhance guest experience.
💸 Revenue & Profitability Monitoring
Monitor the park’s revenue from ticket sales, food, and merchandise. Compare actual revenue against targets, identify profitable areas, and optimize pricing strategies to increase overall profitability.
🎠 Ride Performance Metrics
Track the performance of individual rides and attractions. Measure key metrics such as ride wait times, capacity, operational downtime, and customer satisfaction to identify areas for improvement and enhance ride efficiency.
🤖 Operational Efficiency Monitoring
Evaluate the operational efficiency of your theme park by tracking employee productivity, operational costs, and maintenance schedules. Identify areas where resources can be optimized and costs can be reduced.
🗣 Customer Satisfaction & Feedback Analysis
Collect and analyze customer feedback through surveys, reviews, and satisfaction scores. Monitor visitor satisfaction levels to ensure high-quality service and identify opportunities for service improvement.
📈 Time-Based Performance Analysis
Monitor park performance over time, track daily, weekly, and monthly trends, and identify seasonal patterns. Use this information to optimize park operations during peak and off-peak seasons.
Why You’ll Love the Theme Park KPI Dashboard in Excel
✅ Comprehensive Visitor Insights
Track attendance, demographics, and visitor engagement to better understand guest behavior and improve experiences.
✅ Increase Revenue & Profitability
Monitor revenue streams such as ticket sales, food, and merchandise, and optimize pricing strategies to boost profitability.
✅ Improve Ride Efficiency & Customer Experience
Monitor ride performance, minimize wait times, and optimize ride schedules to enhance overall visitor satisfaction and operational efficiency.
✅ Streamline Operations
Track employee performance, costs, and operational metrics to optimize processes, improve resource allocation, and reduce operational costs.
✅ Data-Driven Decision Making
Use the insights from the dashboard to make informed decisions that drive profitability, enhance visitor experience, and improve park operations.
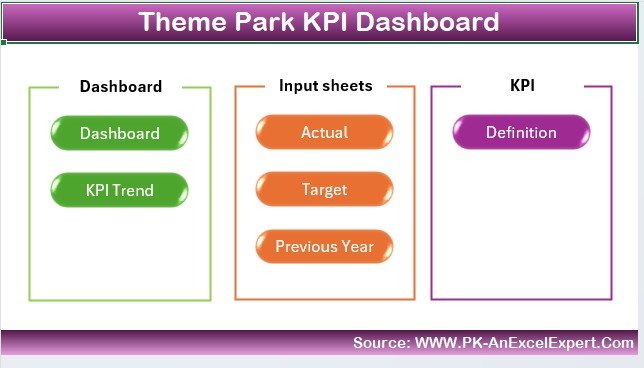
What’s Inside the Theme Park KPI Dashboard in Excel?
-
Visitor Attendance & Engagement: Track and analyze visitor trends and demographics.
-
Revenue & Profitability Monitoring: Monitor ticket sales, food, and merchandise revenue.
-
Ride Performance Metrics: Track ride wait times, capacity, downtime, and customer satisfaction.
-
Operational Efficiency Metrics: Monitor employee productivity, costs, and maintenance schedules.
-
Customer Feedback & Satisfaction: Collect and analyze customer satisfaction data.
-
Time-Based Analysis: Track daily, weekly, and monthly park performance.
How to Use the Theme Park KPI Dashboard in Excel
1️⃣ Download the Template: Instantly access the Theme Park KPI Dashboard in Excel.
2️⃣ Input Your Data: Add data such as visitor attendance, revenue, and ride performance metrics.
3️⃣ Track KPIs & Performance: Monitor visitor trends, ride efficiency, and revenue generation in real time.
4️⃣ Analyze Trends & Patterns: Use time-based analysis to identify seasonal trends and optimize park operations.
5️⃣ Make Data-Driven Decisions: Use insights to enhance visitor experience, optimize operations, and boost profitability.
Who Can Benefit from the Theme Park KPI Dashboard in Excel?
🔹 Theme Park Operators & Managers
🔹 Amusement Park Directors & Staff
🔹 Financial Analysts & Revenue Managers
🔹 Operations & Customer Service Teams
🔹 Marketing & Customer Engagement Teams
🔹 Small to Large Theme Parks & Amusement Centers
Ensure smooth operations, enhance customer experience, and boost profitability with the Theme Park KPI Dashboard in Excel. Track critical KPIs and gain valuable insights to optimize your park’s performance and grow your business.
Click here to read the Detailed blog post
Visit our YouTube channel to learn step-by-step video tutorials
Youtube.com/@PKAnExcelExpert


Reviews
There are no reviews yet.