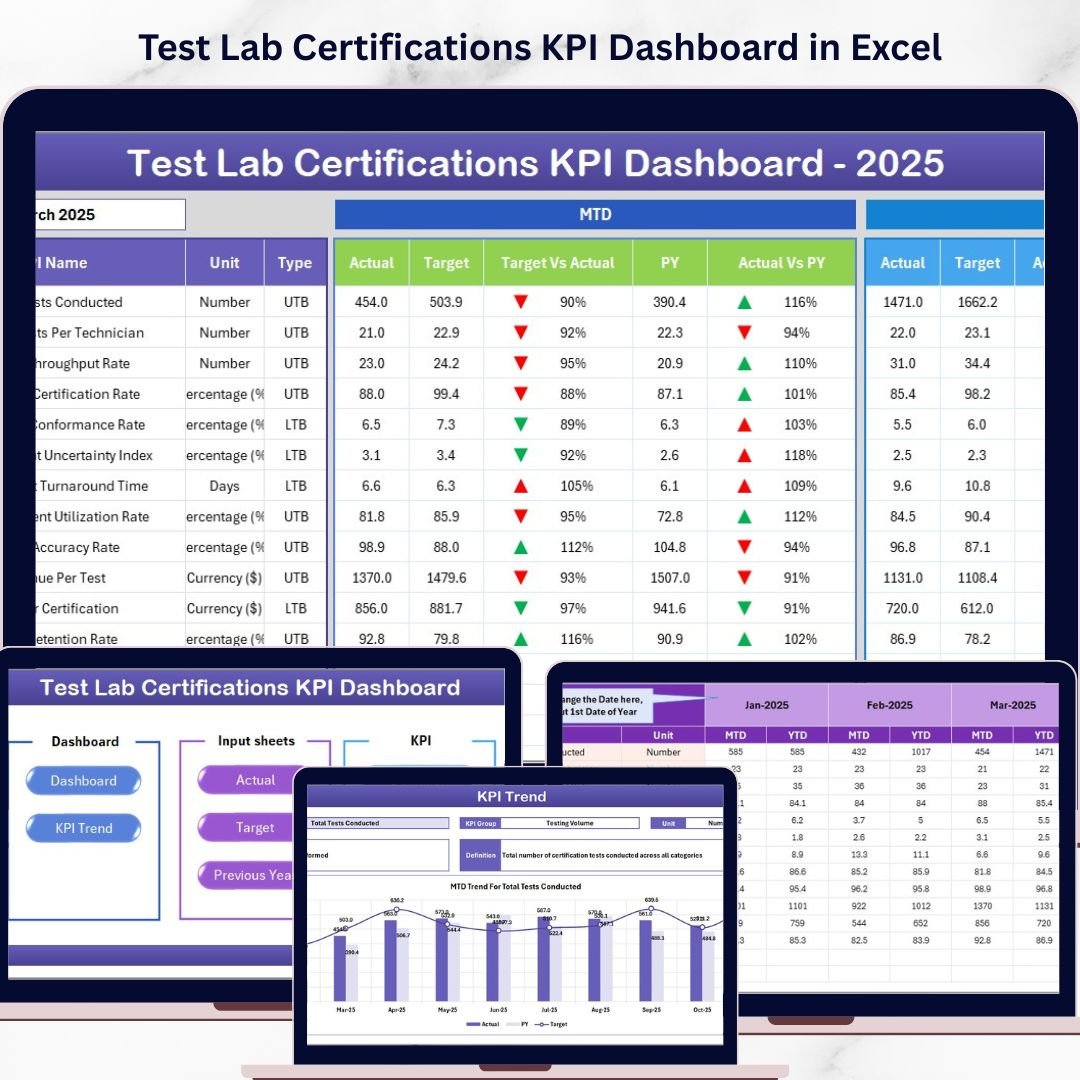

Key Features of Test Lab Certifications KPI Dashboard
Unlock the full potential of your test lab operations with the Test Lab Certifications KPI Dashboard-a comprehensive digital tool designed to track, analyze, and optimize your Key Performance Indicators (KPIs) effortlessly. This dashboard comes packed with seven meticulously crafted worksheets that provide a seamless user experience and actionable insights for enhanced decision-making.
Start with the Home Sheet, which acts as a navigational hub featuring six intuitive buttons that quickly direct you to the respective sheets. This ensures you spend more time analyzing data and less time searching for it.
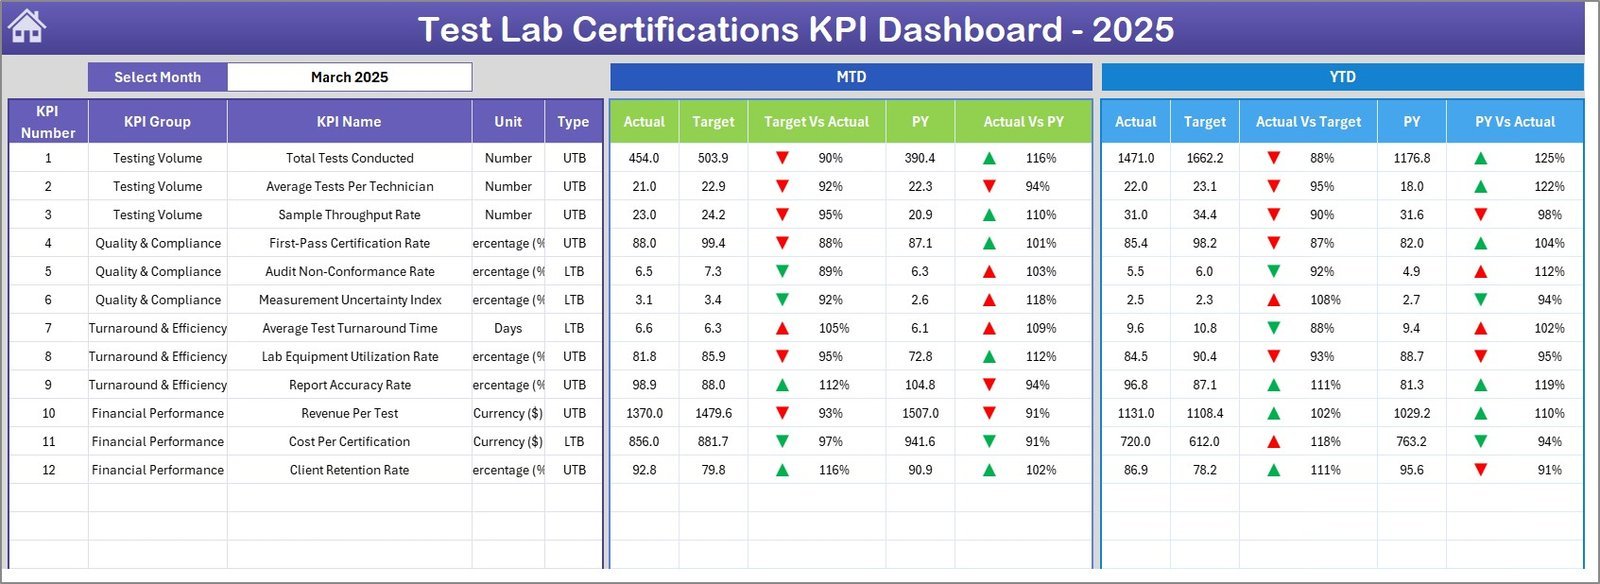
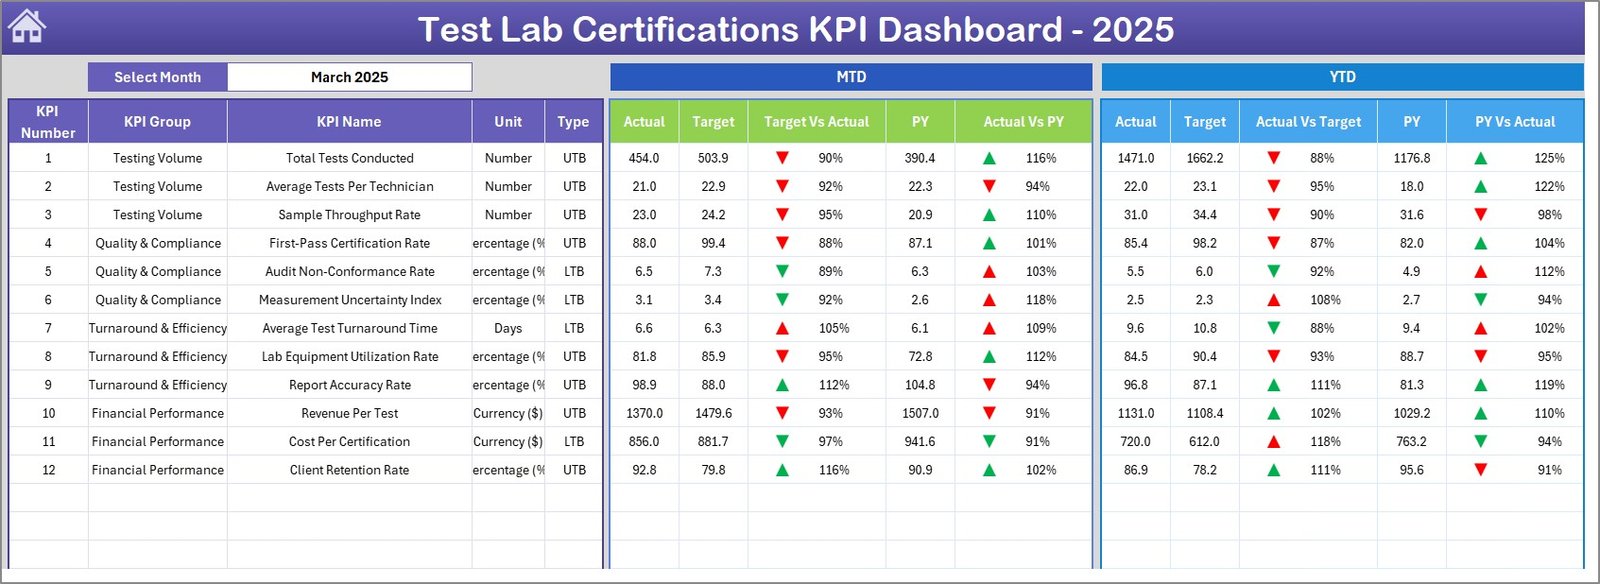
The Dashboard Sheet is the powerhouse of this tool, allowing you to select any month via a drop-down menu (cell D3), instantly updating all KPI data to reflect Month-To-Date (MTD) and Year-To-Date (YTD) actuals, targets, and previous year comparisons. Conditional formatting with up/down arrow indicators highlights performance trends, making it easy to spot successes or areas that need improvement.
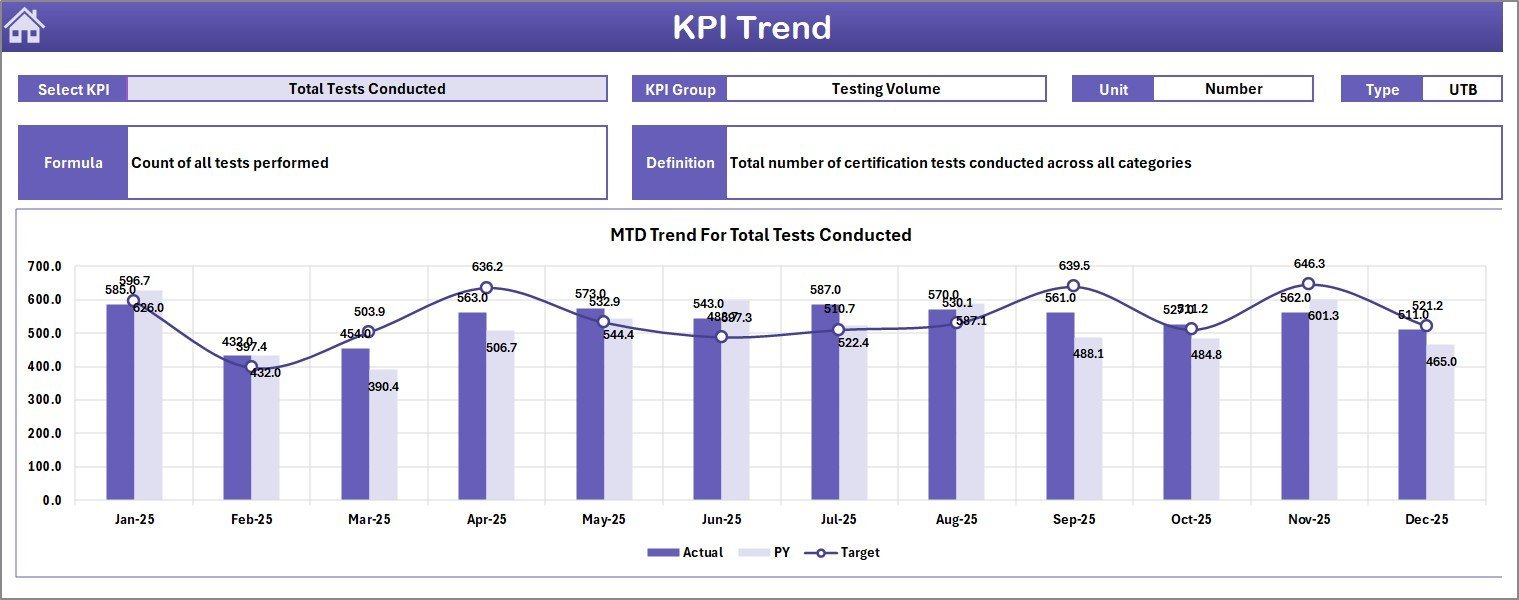
Explore the KPI Trend Sheet to dive deeper into individual KPI performances. Select any KPI from the drop-down (cell C3) and view detailed information including KPI group, unit, type (Lower The Better or Upper The Better), formula, and definition. Dynamic charts visualize MTD and YTD trends for actual, target, and previous year data, turning raw numbers into meaningful stories.
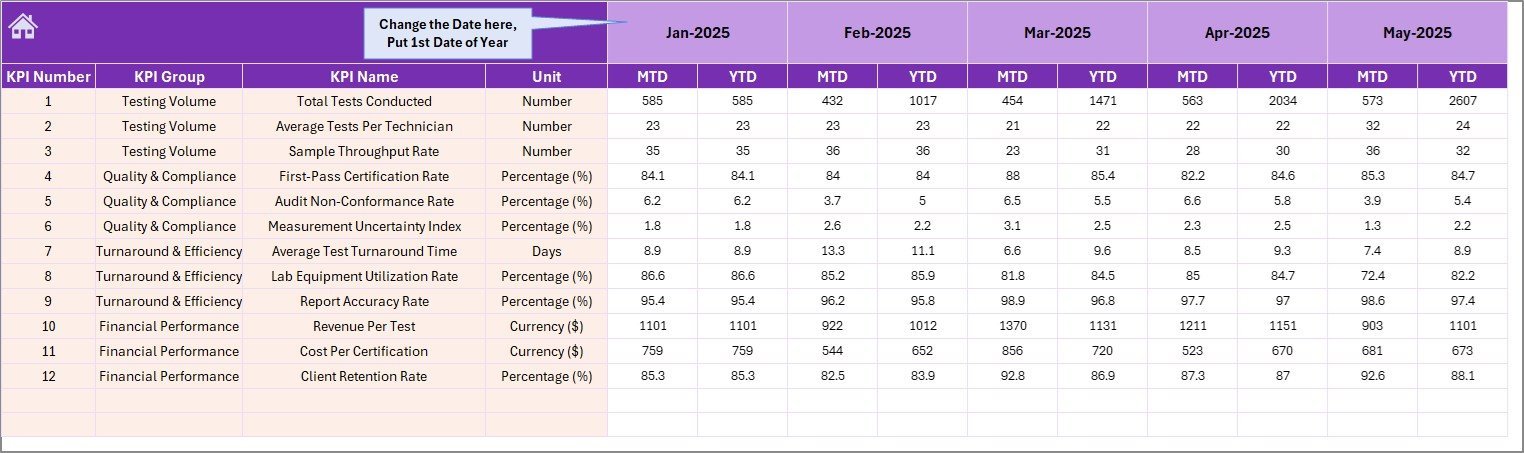
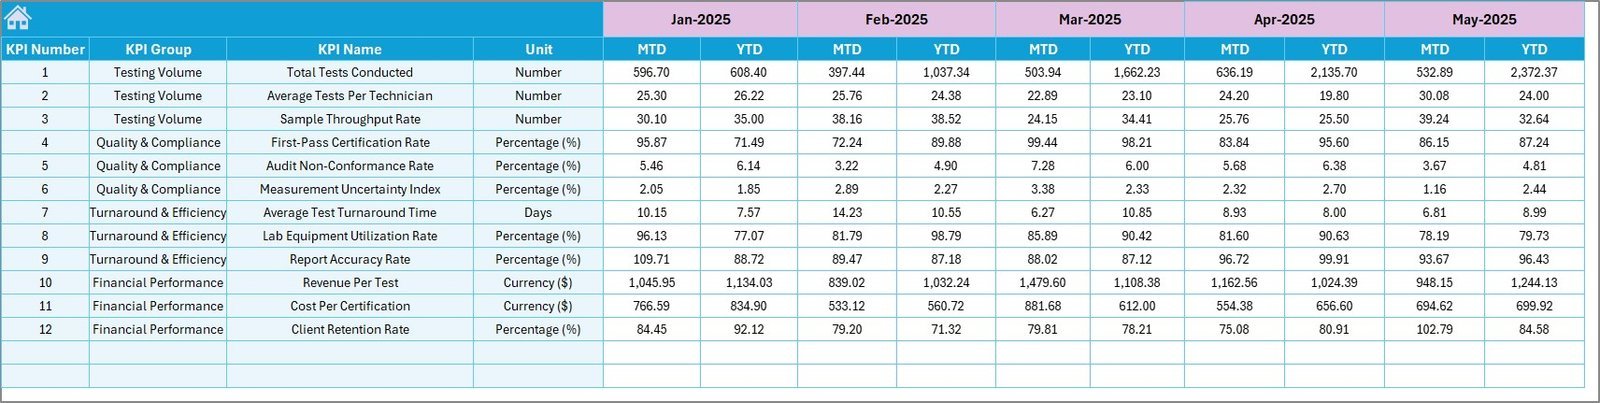
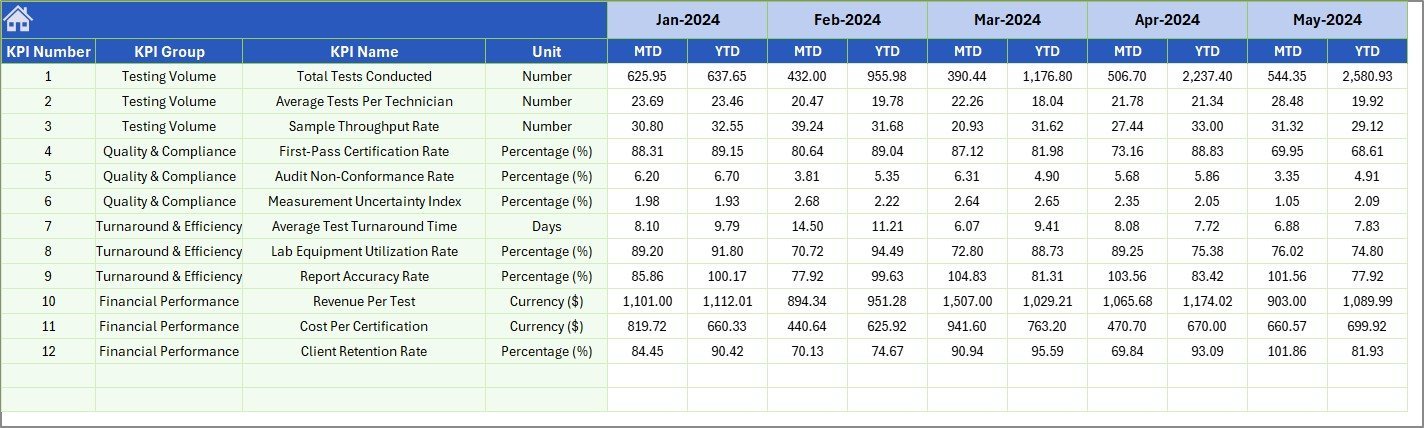
Inputting data is streamlined with dedicated sheets: Actual Numbers Input for entering MTD and YTD actuals, Target Number Input for setting monthly targets, and Previous Year Number for entering last year’s figures to enable comprehensive year-on-year analysis. Each input sheet is designed for ease of use, featuring dropdowns and clear data entry points.
Lastly, the KPI Definition Sheet allows customization and clarity by letting you define KPI names, groups, units, formulas, definitions, and type (LTB or UTB), ensuring the dashboard is tailored perfectly to your lab’s specific needs.
What’s Inside the Test Lab Certifications KPI Dashboard
- 🏠 Home Sheet: Central index with navigation buttons for quick access.
- 📊 Dashboard Sheet: Comprehensive KPI overview with monthly and YTD data, including conditional formatting for quick insights.
- 📈 KPI Trend Sheet: Detailed KPI selection with trend charts and KPI metadata.
- 📝 Actual Numbers Input: Easy input for actual monthly and YTD numbers.
- 🎯 Target Number Input: Set monthly and YTD targets for KPIs.
- 📅 Previous Year Number: Input last year’s data for accurate comparisons.
- 📚 KPI Definition Sheet: Customize KPI names, formulas, and types for precise tracking.
How to Use the Test Lab Certifications KPI Dashboard
Using the dashboard is straightforward and requires minimal setup:
- 🔹 Start at the Home Sheet to navigate to your desired section.
- 🔹 Enter your Actual Numbers for each KPI and month in the respective input sheet.
- 🔹 Input your Target Numbers corresponding to the same periods to set benchmarks.
- 🔹 Add Previous Year Numbers to enable year-on-year performance analysis.
- 🔹 Define or update KPI details in the KPI Definition Sheet to ensure accuracy and clarity.
- 🔹 Use the Dashboard Sheet to monitor month-to-date and year-to-date performance through visual cues and comparisons.
- 🔹 Analyze trends and KPI behavior over time using the KPI Trend Sheet.
This intuitive flow helps you keep your certification processes on track, spot bottlenecks quickly, and make data-driven decisions to enhance lab efficiency.
Who Can Benefit from This Test Lab Certifications KPI Dashboard
Whether you’re a lab manager, quality control specialist, or executive overseeing test lab certifications, this dashboard is tailored for you:
- 👩🔬 Lab Managers: Streamline monitoring of certification KPIs to ensure compliance and productivity.
- 📈 Quality Assurance Teams: Easily track performance against targets to maintain high standards.
- 🧑💼 Executives & Decision Makers: Access real-time KPI data for strategic decisions and resource allocation.
- 🛠️ Operations Staff: Enter and maintain accurate data for precise reporting.
- 📊 Data Analysts: Utilize trend data and conditional formatting to generate insightful reports.
- 🏢 Accreditation Bodies: Verify lab performance and certification status efficiently.
Empower your team with a KPI dashboard built specifically for the unique demands of test lab certifications and watch your operational performance soar.
Click here to read the Detailed blog post.
Visit our YouTube channel to learn step-by-step video tutorials.


Reviews
There are no reviews yet.