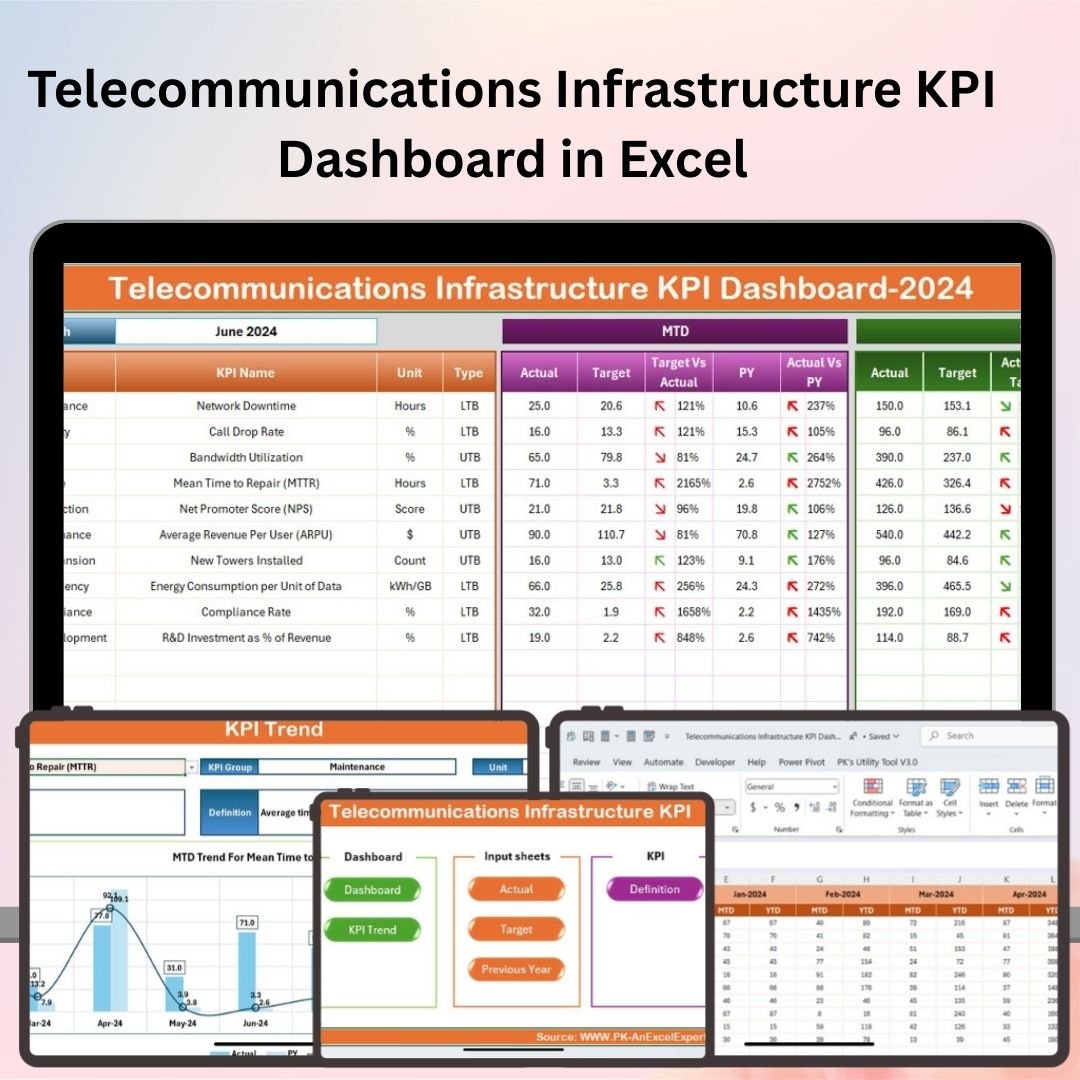


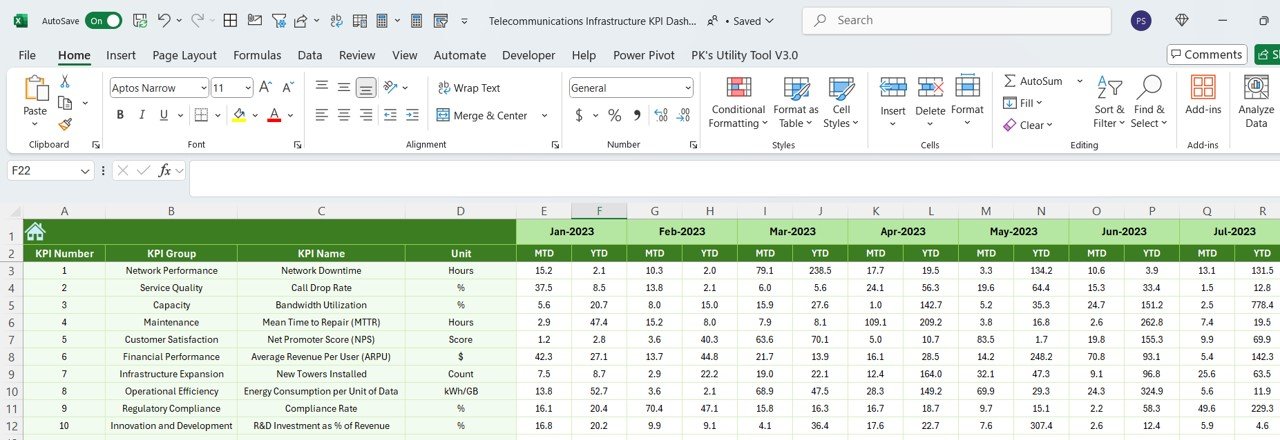

The Telecommunications Infrastructure KPI Dashboard in Excel is an essential tool for network managers, telecommunications providers, and infrastructure teams to monitor and optimize the performance of telecommunications networks. This Excel-based dashboard allows you to track key performance indicators (KPIs) such as network uptime, bandwidth usage, equipment performance, and operational costs, helping you identify inefficiencies, optimize infrastructure, and ensure high-quality service delivery.
With real-time data tracking, customizable reports, and visual performance metrics, this dashboard ensures that you can make data-driven decisions to improve network performance and reduce operational costs, while maximizing your infrastructure’s potential.
Key Features of the Telecommunications Infrastructure KPI Dashboard in Excel:
📶 Network Performance Monitoring
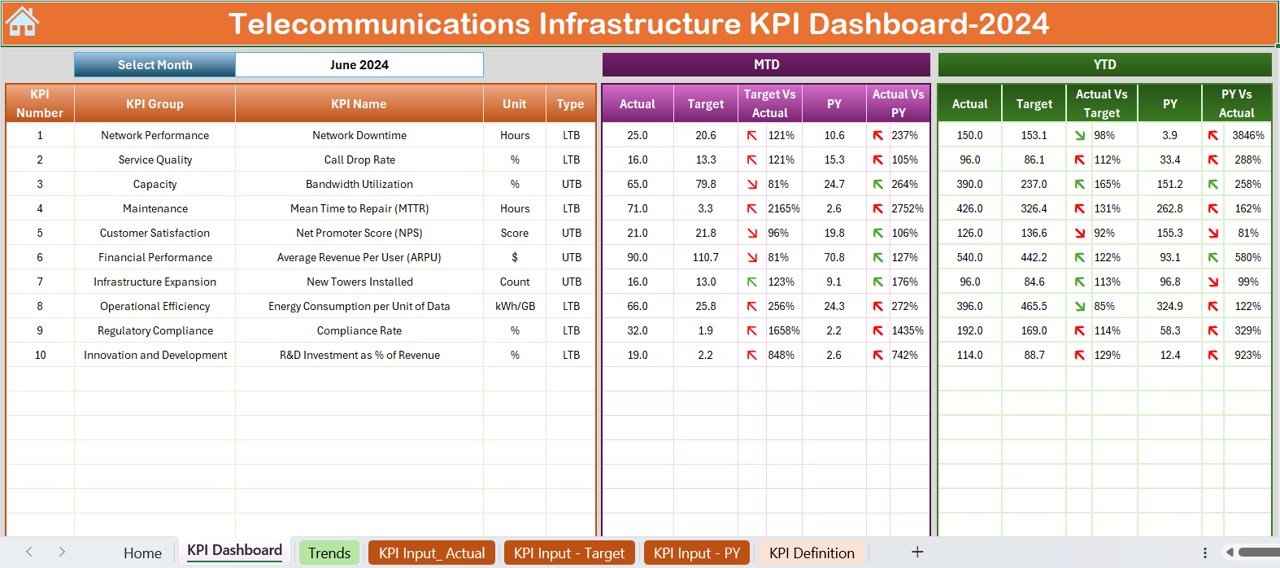
Track the performance of your telecommunications network, including network uptime, service availability, and connectivity quality, ensuring that your infrastructure operates optimally.
📊 Bandwidth and Traffic Analysis
Monitor bandwidth usage, traffic loads, and network congestion, helping you manage resources efficiently and plan for future network upgrades.
⚙️ Equipment and System Monitoring
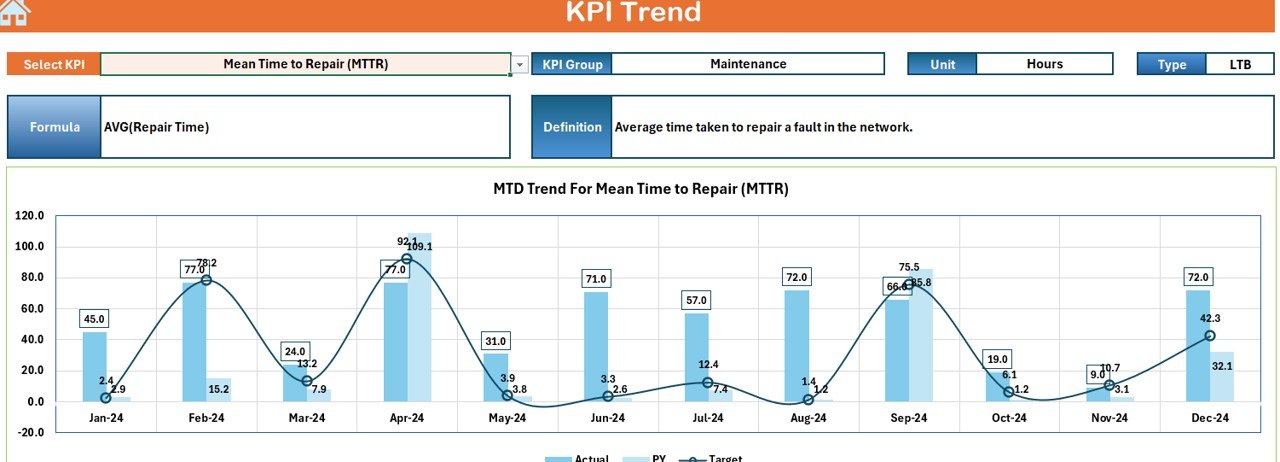
Track the performance of critical equipment and systems, including routers, switches, and servers, ensuring that all infrastructure components are working efficiently and within capacity.
💸 Operational Costs and Resource Management
Track operational expenses, including equipment maintenance, electricity costs, and staffing, helping you manage your network infrastructure budget effectively.
📅 Incident and Downtime Tracking
Monitor incidents, outages, and downtimes across the network, allowing you to take corrective actions and minimize future disruptions.
🚀 Why You’ll Love the Telecommunications Infrastructure KPI Dashboard in Excel:
✅ Monitor Network Performance – Track network uptime, service availability, and quality of service to ensure optimal performance and prevent downtime.
✅ Optimize Bandwidth Usage – Monitor bandwidth consumption and network traffic patterns to optimize resource allocation and reduce congestion.
✅ Manage Infrastructure Efficiency – Track equipment performance and system health to prevent failures and ensure that critical infrastructure remains operational.
✅ Control Operational Costs – Keep track of operational expenses, including maintenance, electricity, and staff costs, ensuring that your infrastructure remains cost-efficient.
✅ Track Incident and Downtime Data – Analyze incidents and downtimes to identify trends and proactively address infrastructure weaknesses.
✅ Customizable and Easy-to-Use – Fully customizable to match your telecommunications infrastructure needs, with a user-friendly interface that makes tracking KPIs easy.
What’s Inside the Telecommunications Infrastructure KPI Dashboard in Excel:
-
Network Performance: Track network uptime, service availability, and overall network performance to ensure your infrastructure is delivering quality service.
-
Bandwidth Usage and Traffic: Monitor bandwidth consumption, peak traffic times, and congestion, helping you manage network capacity and plan for scalability.
-
Equipment Performance: Track the performance of critical telecommunications equipment, such as routers, servers, and switches, to ensure they are functioning efficiently.
-
Operational Costs: Monitor expenses related to equipment maintenance, power usage, and staffing, helping you stay within budget while optimizing performance.
-
Incident Tracking: Monitor and analyze network incidents, outages, and downtimes, helping you identify causes and improve future performance.
-
Custom Reports: Generate tailored reports to summarize performance metrics, cost breakdowns, and incident logs, helping you make data-driven decisions.
How to Use the Telecommunications Infrastructure KPI Dashboard in Excel:
1️⃣ Download the Template – Instantly access your Excel file upon purchase.
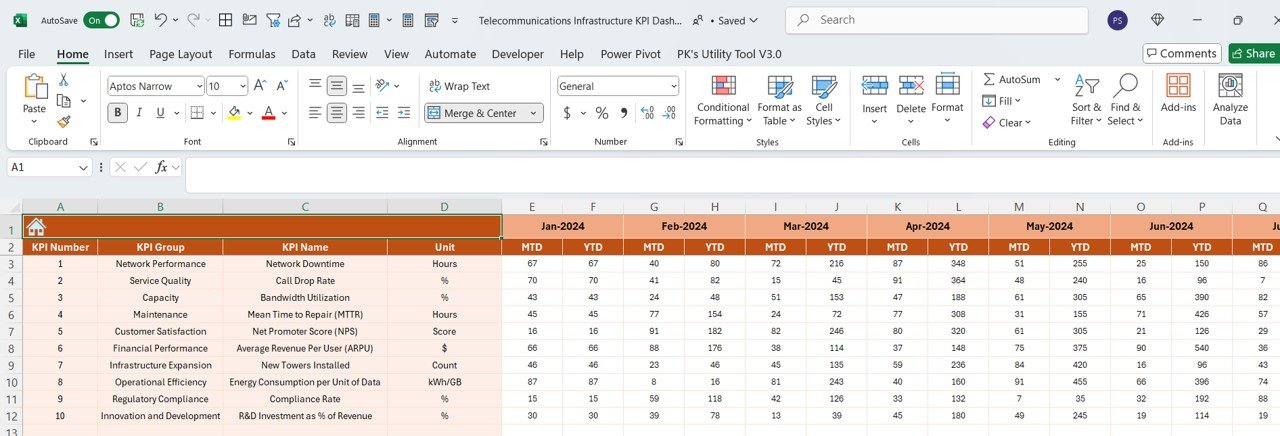
2️⃣ Input Data for Network and Equipment – Enter data for network performance, bandwidth usage, equipment performance, and costs to start tracking KPIs.
3️⃣ Monitor Key Metrics – Use the dashboard to track network uptime, traffic loads, operational expenses, and equipment performance in real-time.
4️⃣ Analyze Incident and Downtime Trends – Track network incidents and downtimes to identify recurring issues and improve system reliability.
5️⃣ Generate Reports – Create customized reports summarizing network performance, costs, and incidents, helping you make informed infrastructure decisions.
Who Can Benefit from the Telecommunications Infrastructure KPI Dashboard in Excel:
-
Network Managers
-
Telecommunications Providers
-
Infrastructure and Operations Teams
-
IT and Network Engineers
-
Telecom Project Managers
-
Financial Managers in Telecom
-
Small to Large Telecommunication Companies
-
Public Sector Agencies Managing Telecommunications
The Telecommunications Infrastructure KPI Dashboard in Excel is the perfect tool for managing and optimizing your telecommunications network. From tracking network performance and bandwidth usage to monitoring equipment efficiency and managing operational costs, this dashboard provides the insights you need to make better decisions and improve service delivery.
Click here to read the Detailed blog post
https://www.pk-anexcelexpert.com/telecommunications-infrastructure-kpi-dashboard-in-excel/
Visit our YouTube channel to learn step-by-step video tutorials
Youtube.com/@PKAnExcelExpert


Reviews
There are no reviews yet.