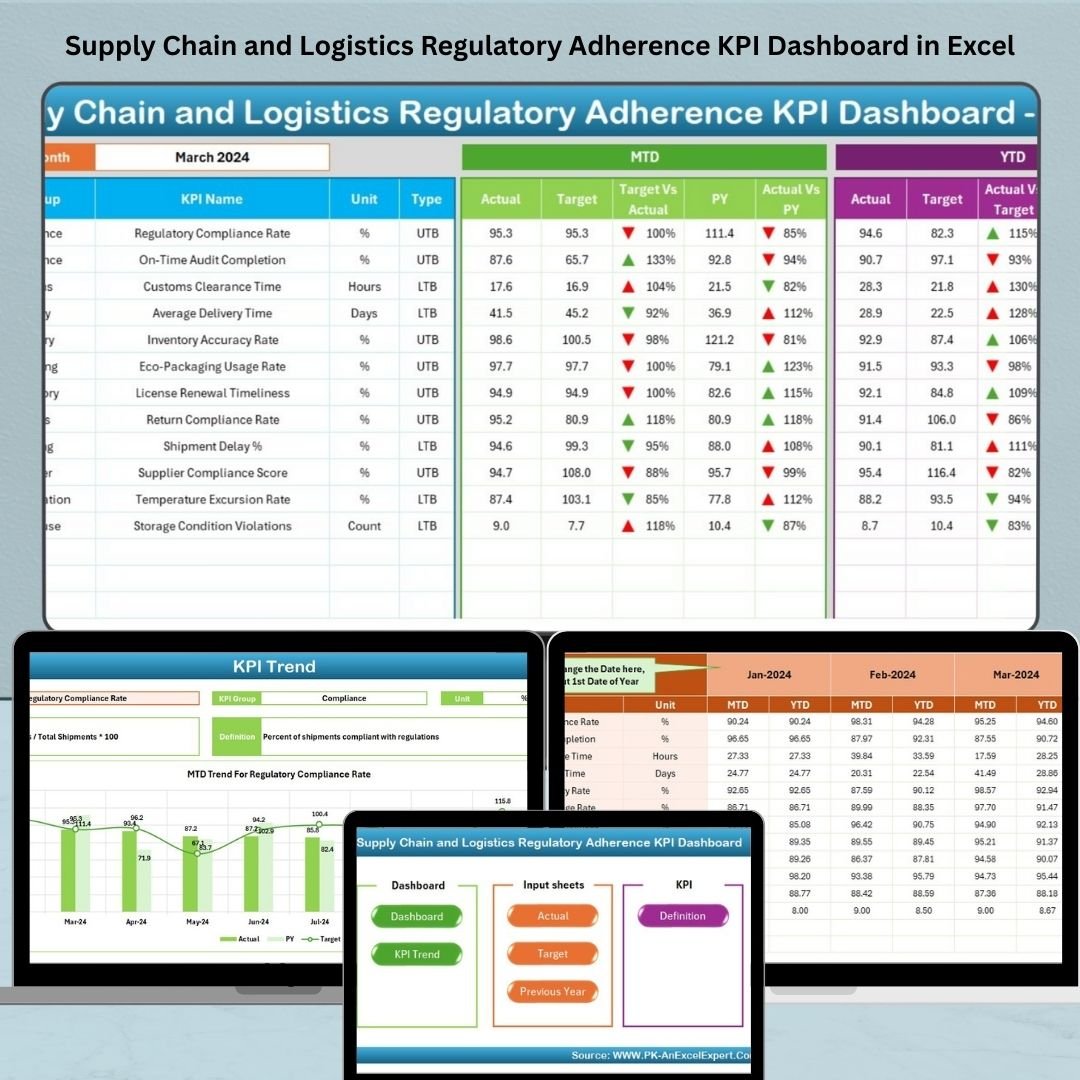
In today’s global supply chain landscape, one thing is certain—regulatory compliance is not optional. From customs procedures to environmental standards, missing a single benchmark could cost you time, money, or worse—your reputation. That’s why we created the Supply Chain and Logistics Regulatory Adherence KPI Dashboard in Excel, your all-in-one solution for tracking regulatory KPIs with precision.
Whether you’re a compliance officer, logistics analyst, or supply chain consultant, this dashboard equips you with the tools to monitor, analyze, and act—all within Excel. No code. No fluff. Just clear, actionable insights.
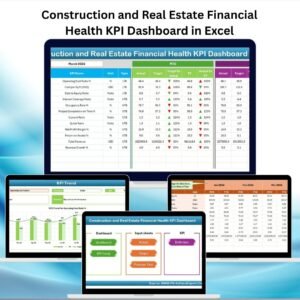
✨ Key Features of Supply Chain & Logistics Regulatory Adherence KPI Dashboard
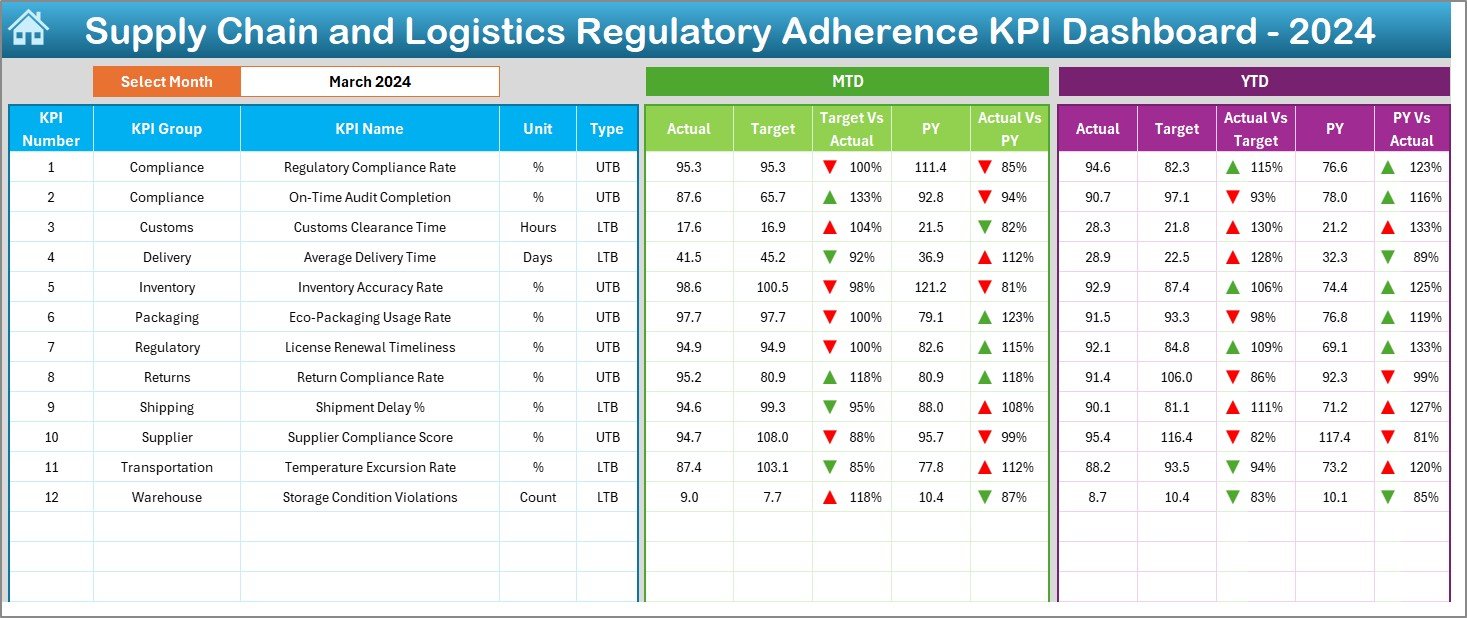
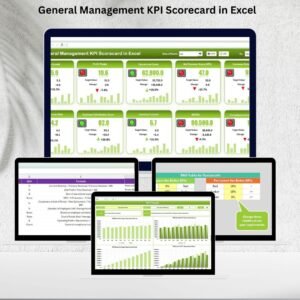
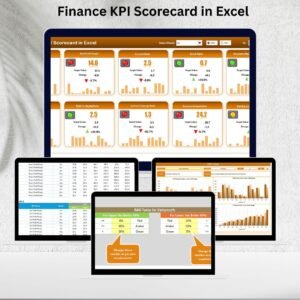
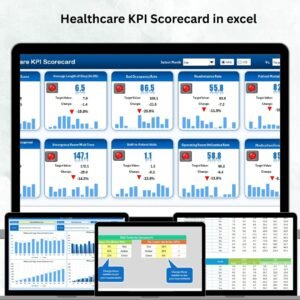
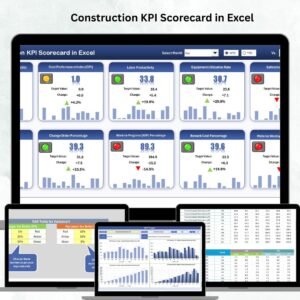
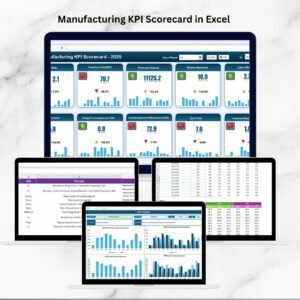
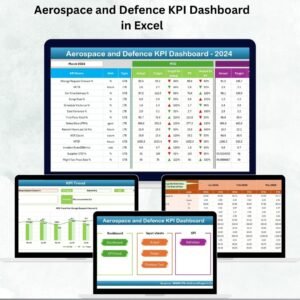
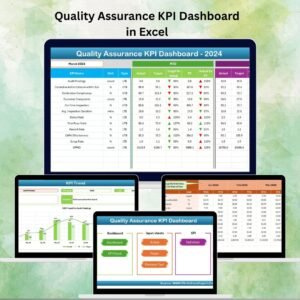
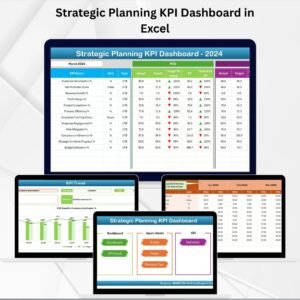
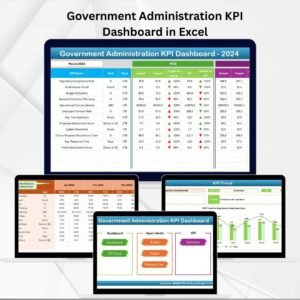
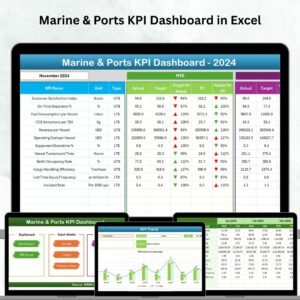
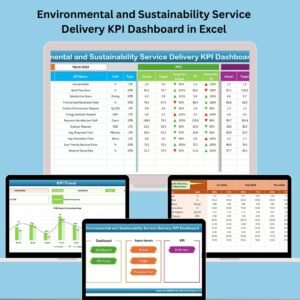
📊 Interactive Dashboard View
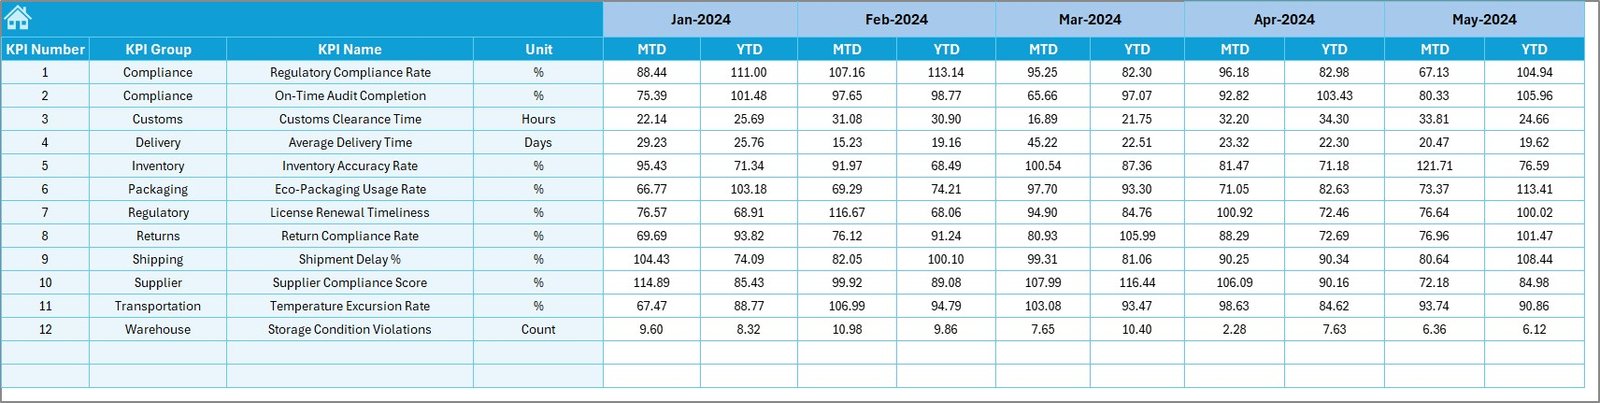
Select any month from a drop-down and instantly see:
-
MTD (Month-To-Date): Actual vs Target vs Previous Year
-
YTD (Year-To-Date): Actual vs Target vs Previous Year
-
🔺🔻 Visual indicators with conditional formatting to spot red flags
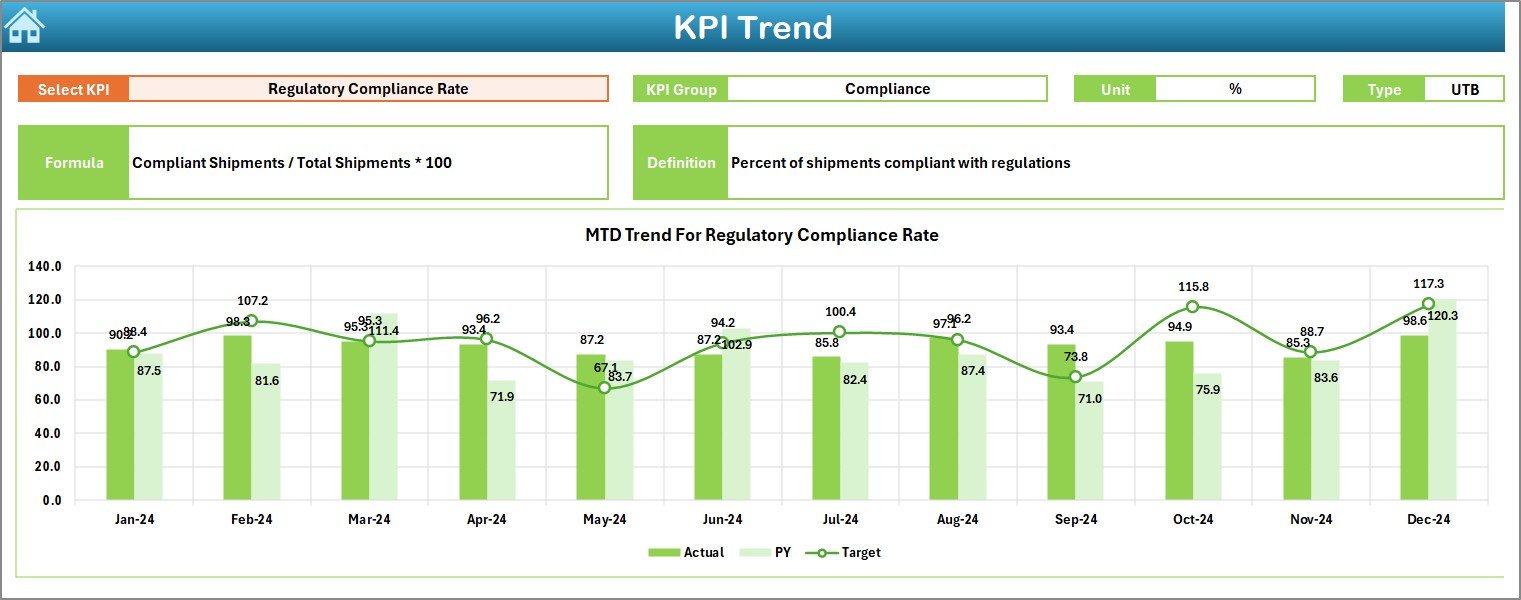
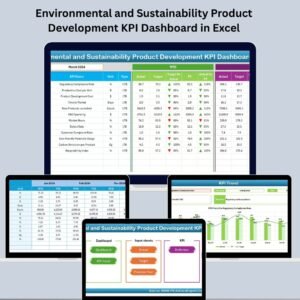
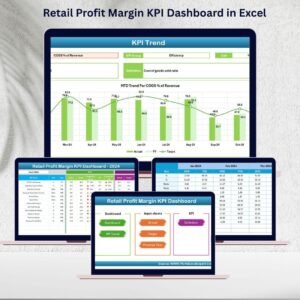
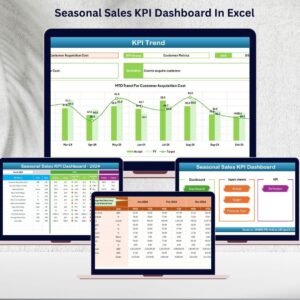
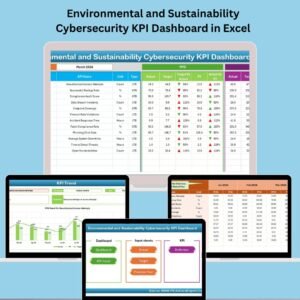
📈 KPI Trend Analysis
Dive deep into KPI behavior over time with dynamic charts showing:
-
MTD & YTD trend comparisons
-
Actual vs Target vs Previous Year
-
Smart slicers to filter by KPI Name
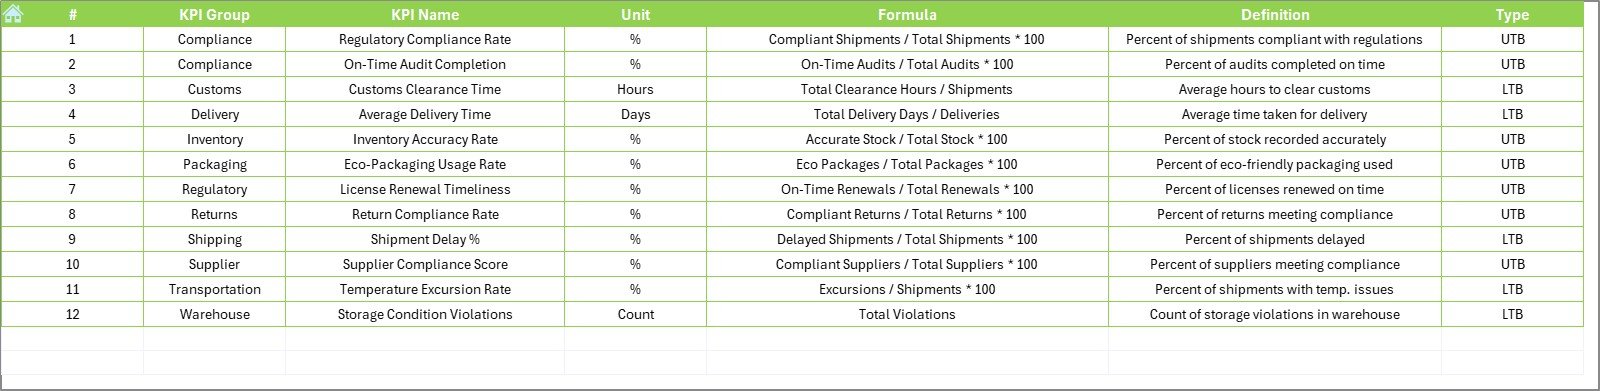
📋 KPI Metadata Management
Organize your performance framework in the KPI Definition Sheet:
-
KPI Group, Name, Unit, Type (LTB/UTB)
-
Formula & business-friendly definitions
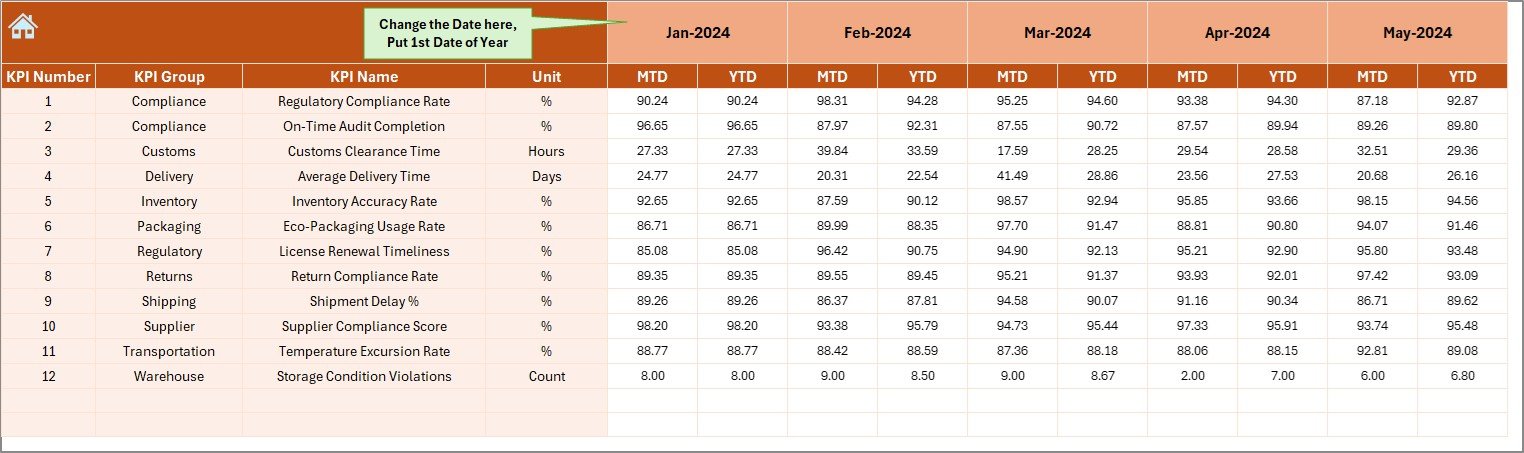
📥 Data Entry Made Simple
Separate sheets for:
-
Actual Numbers (Current year performance)
-
Target Values (Goal setting)
-
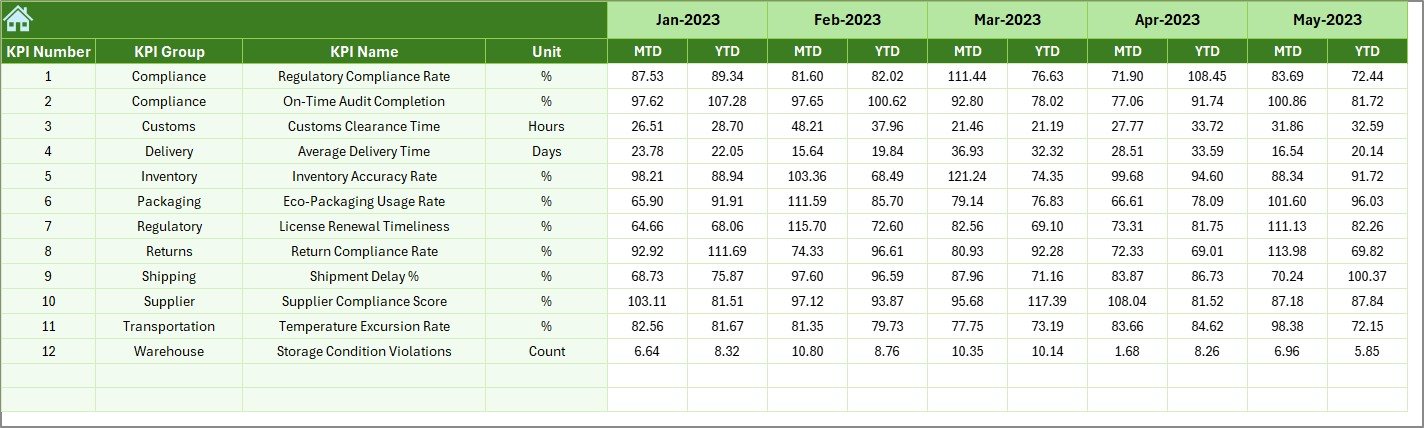
Previous Year Numbers (Benchmarking)
Everything auto-feeds into the dashboard with zero coding needed!
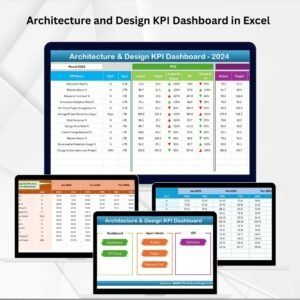
🏠 Home Sheet Navigation
Access any sheet instantly using 6 built-in buttons from the Home Page. Navigate with confidence.
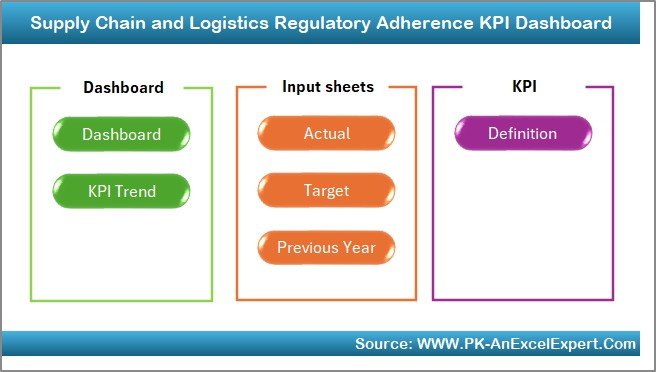
📦 What’s Inside the Dashboard Template?
-
Home Sheet – One-click access to all sections
-
Dashboard Sheet – Month-wise KPI performance view
-
KPI Trend Sheet – KPI-level analysis with chart comparisons
-
Actual Numbers Input Sheet – Input live performance data
-
Target Sheet – Set monthly compliance goals
-
Previous Year Sheet – Track historical data
-
KPI Definition Sheet – Maintain your KPI logic and formulas
Everything is fully integrated—just input your data and watch insights come to life.
🛠 How to Use the Regulatory Compliance Dashboard
-
Set Up KPI Definitions
Start in the KPI Definition Sheet to list all metrics, formulas, and measurement types. -
Input Historical Benchmarks
Use the Previous Year Numbers sheet to fill in last year’s data. -
Define Compliance Targets
Go to the Target Sheet and enter your MTD and YTD monthly goals. -
Update Current Metrics
Use the Actual Numbers Input Sheet to capture current data points. -
Analyze the Dashboard
Navigate to the Dashboard, choose a month, and instantly see performance status. -
Explore Trends
On the KPI Trend Sheet, view patterns and insights that drive real decisions.
👥 Who Can Benefit from This Excel Template?
✅ Supply Chain Managers – Monitor regulatory compliance across shipping, warehousing, and transport
✅ Logistics Analysts – Drill into customs, environmental, and safety KPIs
✅ Regulatory Officers – Ensure policies are met across vendors and borders
✅ Consultants & Auditors – Conduct performance reviews across clients and teams
✅ Warehouse/Transportation Teams – Stay proactive with real-time feedback
If your team’s success depends on operational compliance, this tool is built for you.
📘 Click here to read the Detaile
Watch the step-by-step video tutorial:
d blog post
🎥 Visit our YouTube channel to learn step-by-step video tutorials


Reviews
There are no reviews yet.