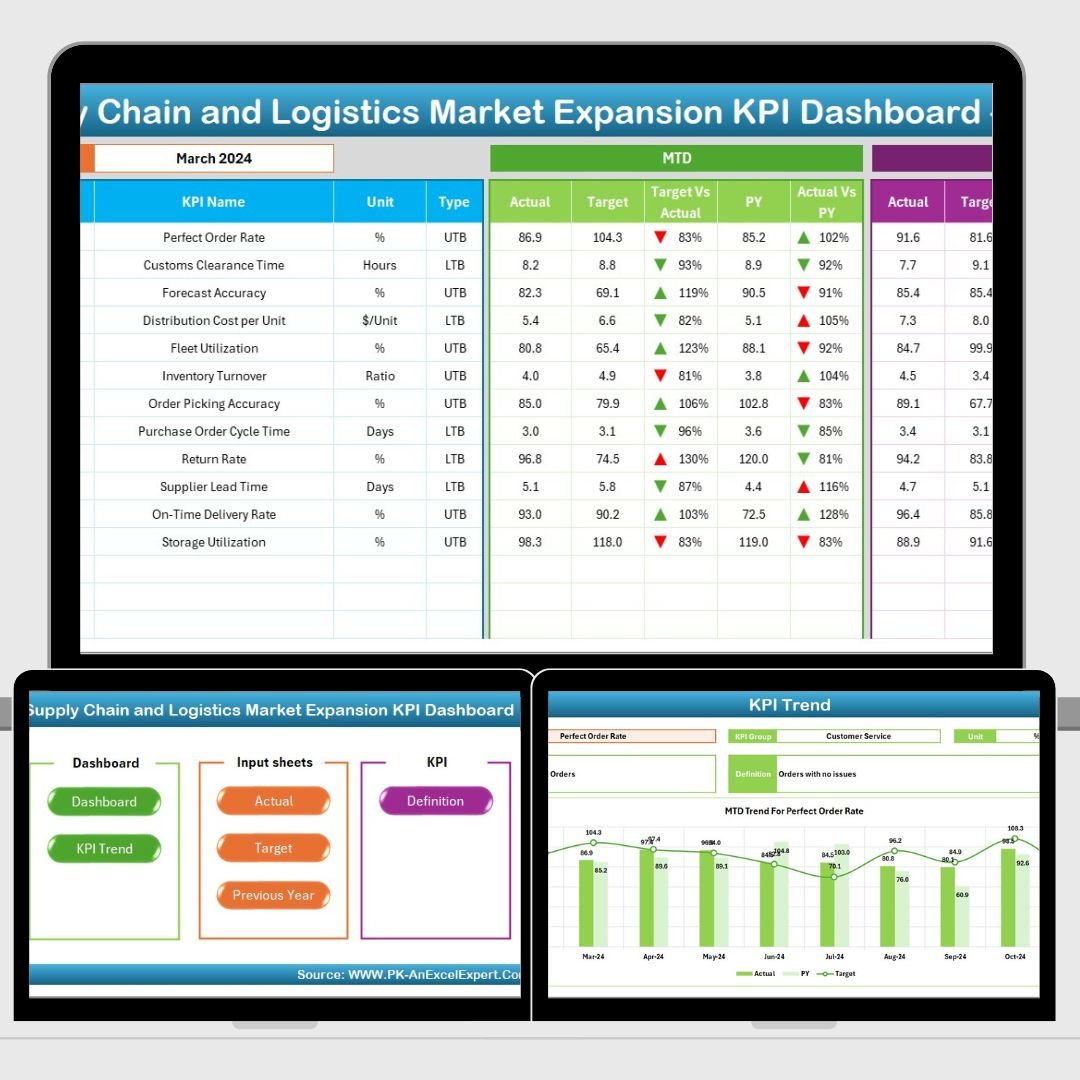
In today’s fast-moving logistics and supply chain industry, growth depends on clarity, speed, and data-driven decisions. That’s where the Supply Chain and Logistics Market Expansion KPI Dashboard in Excel steps in—offering you a fully interactive, easy-to-use, and highly visual dashboard to track your Month-to-Date (MTD), Year-to-Date (YTD), and Previous Year (PY) performance.
Built for professionals managing manufacturing, retail, distribution, or warehouse operations, this Excel tool helps you analyze performance gaps, benchmark trends, and plan your market expansion strategy more effectively—without expensive software or technical setup.
✨ Key Features of Supply Chain Market Expansion KPI Dashboard
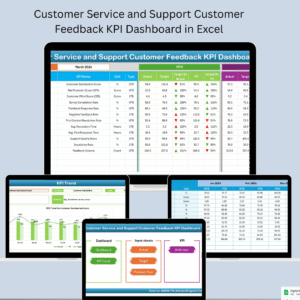
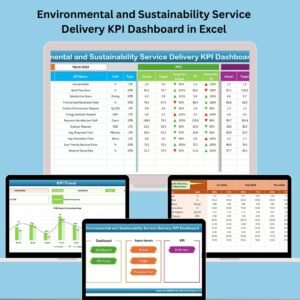
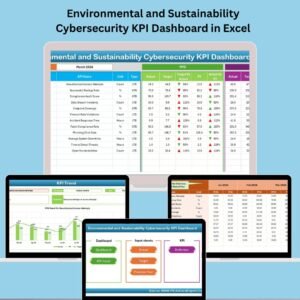
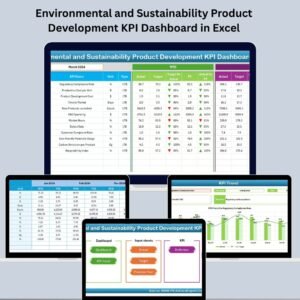
📊 Interactive Main Dashboard
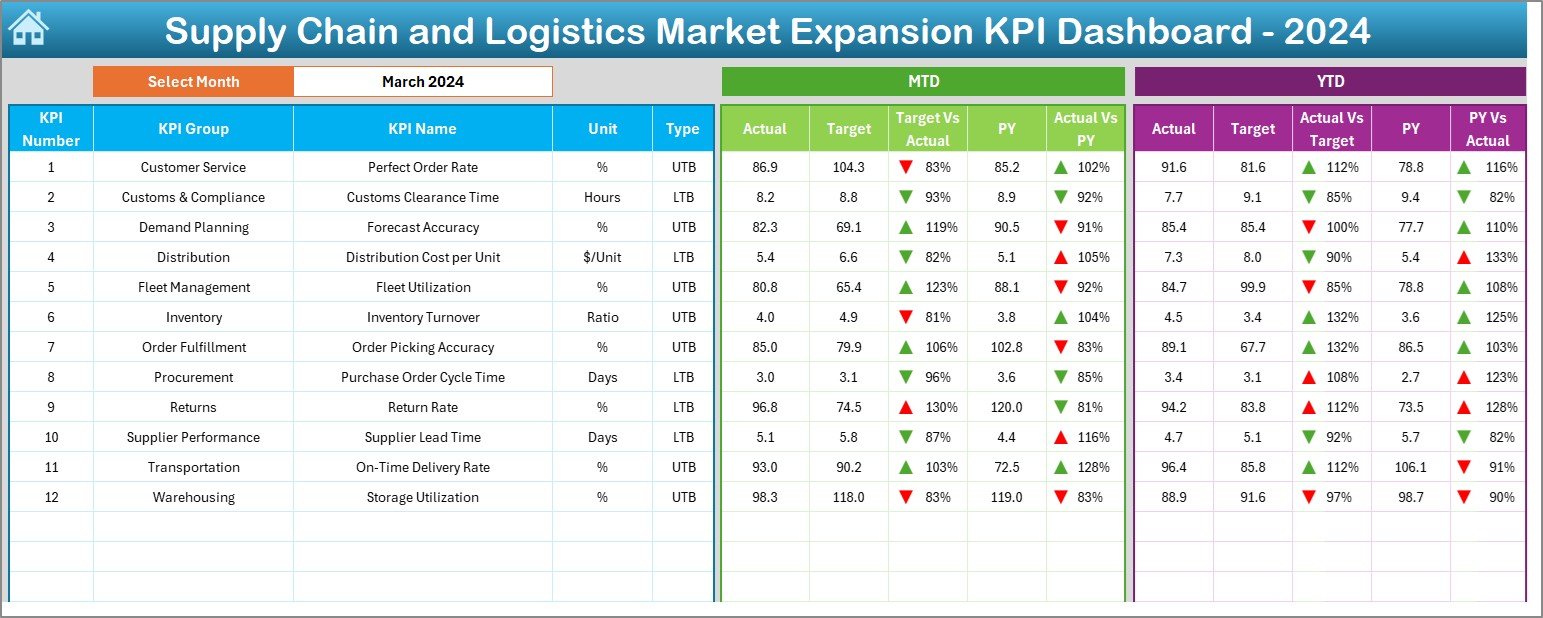
Select any month using a dropdown and instantly see MTD and YTD comparisons for Actual vs. Target and Actual vs. Previous Year with smart up/down arrows.
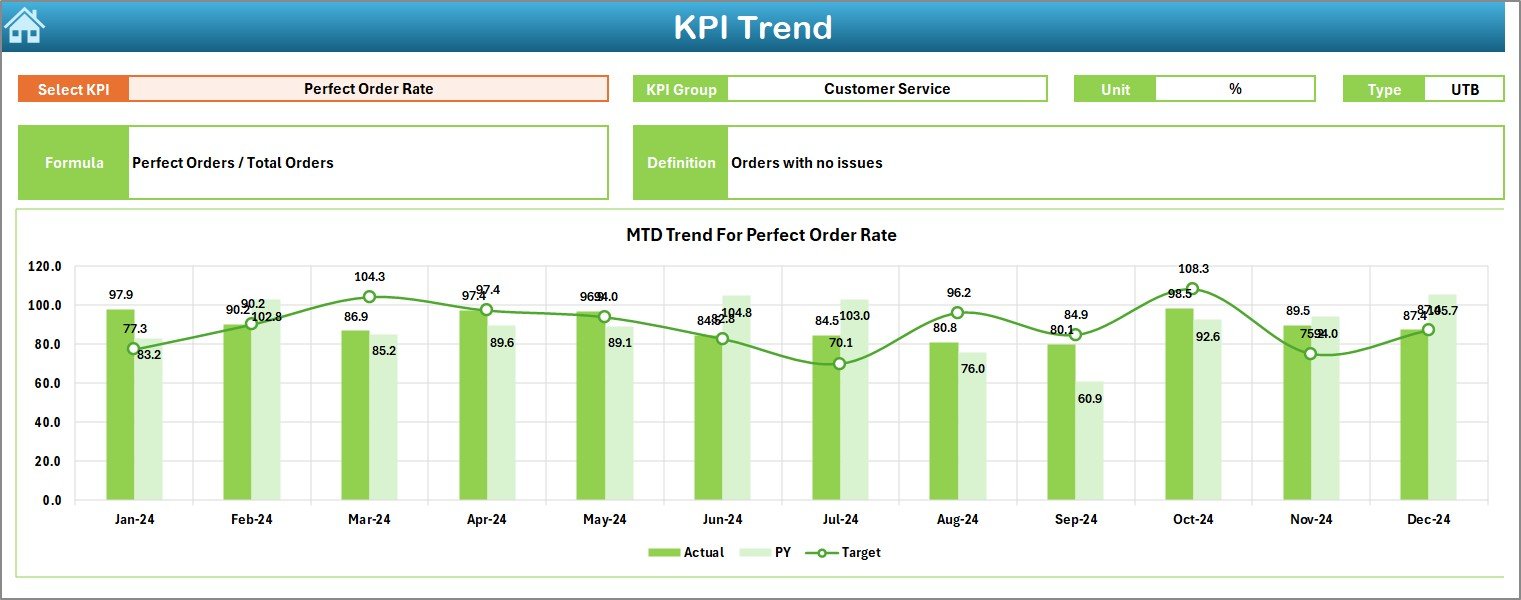
📈 KPI Trend Sheet for Pattern Analysis
Select any KPI to see its performance over time. The sheet auto-populates KPI details and shows trend charts for MTD and YTD performance.
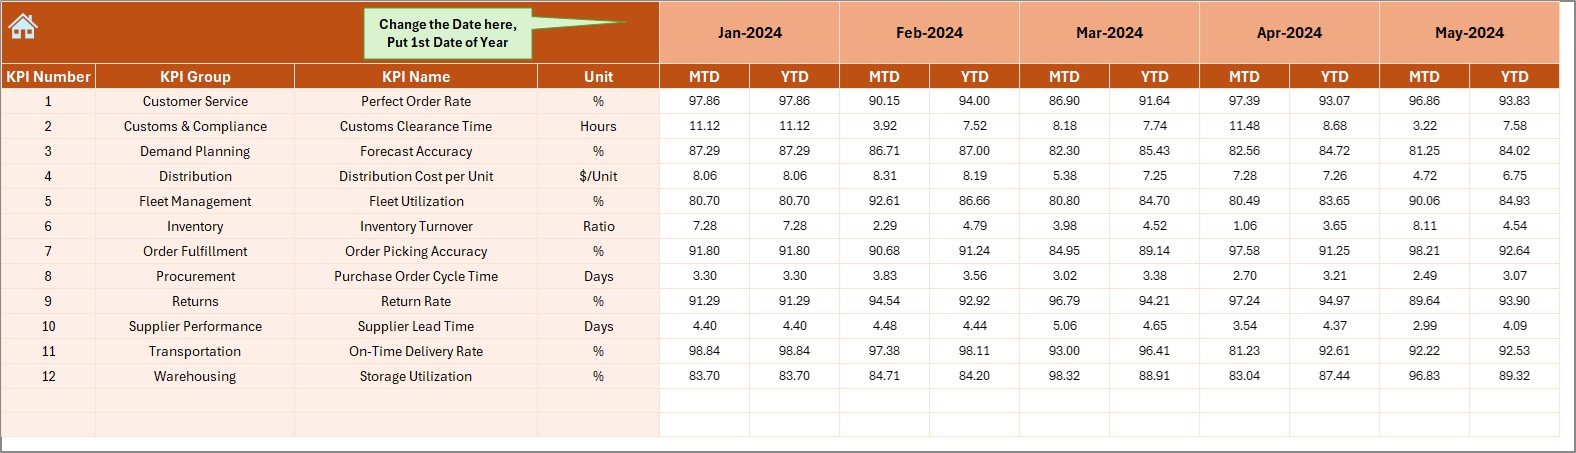
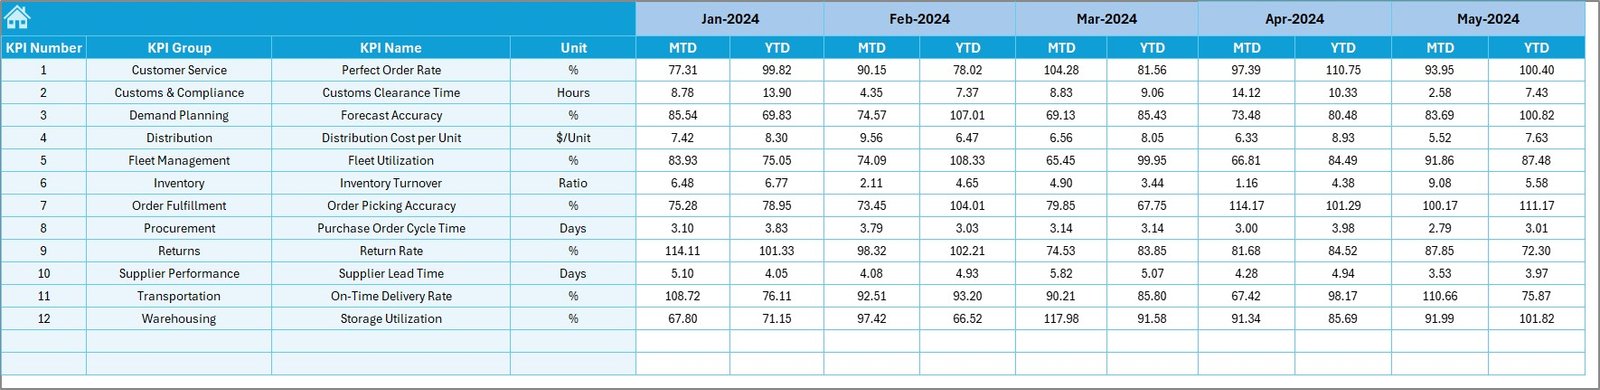
📥 Actual Numbers Input Sheet
Log real-time monthly data for all KPIs. Just set your fiscal start month and enter actuals for each month.
🎯 Target Sheet
Define your monthly and yearly targets for each KPI, setting a benchmark for performance monitoring.
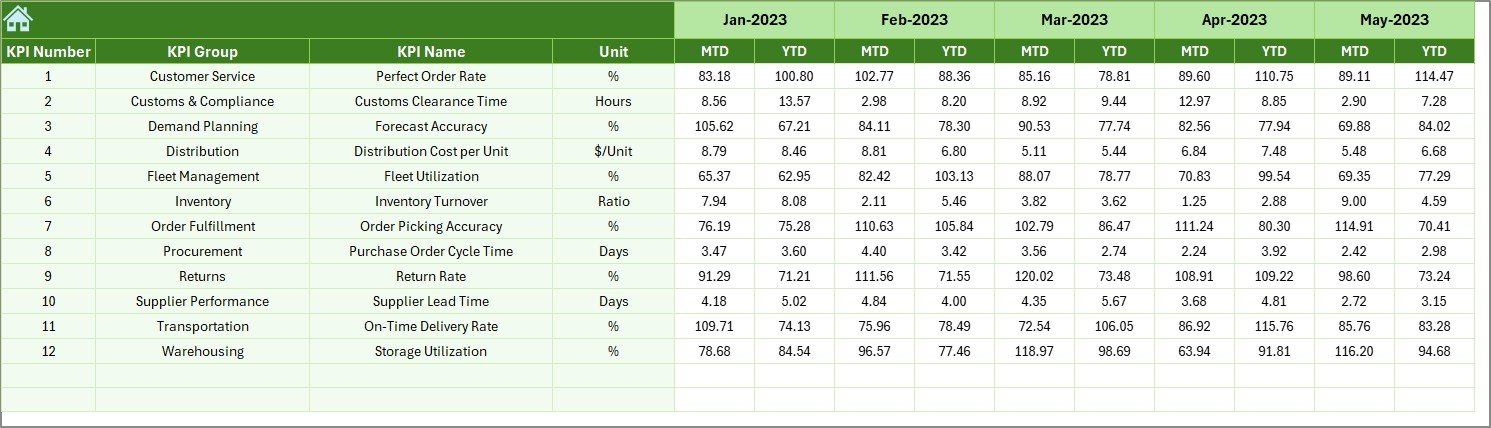
📆 Previous Year Sheet
Add last year’s data to track seasonal fluctuations and year-over-year improvements.
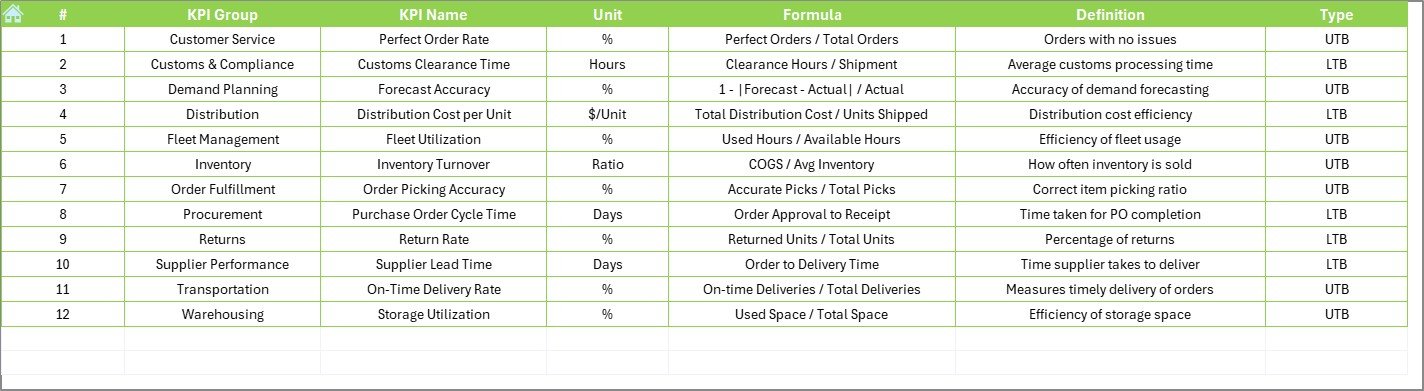
📘 KPI Definition Sheet
Define KPI names, formulas, KPI groups, and whether each metric is “Upper the Better” (UTB) or “Lower the Better” (LTB).
🧭 Home Sheet Navigation Panel
Jump quickly between key sheets using clickable buttons—making this tool fast, intuitive, and team-friendly.
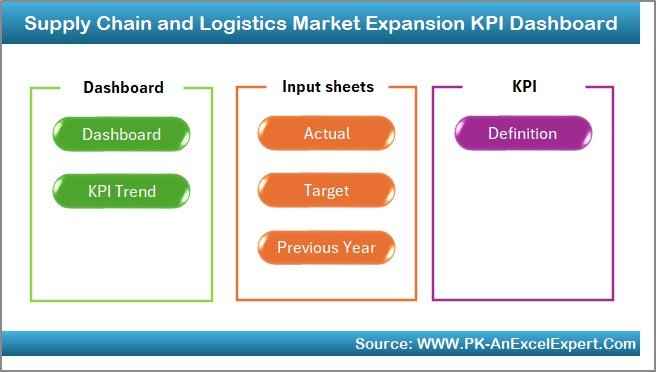
📂 What’s Inside the Excel Dashboard
🟢 Home Sheet – Central navigation panel
📊 Dashboard Sheet – Instant visual feedback for selected month
📈 KPI Trend Sheet – Analyze progress for any KPI
📥 Actual Numbers Input Sheet – Update MTD and YTD actuals
🎯 Target Sheet – Input monthly and yearly goals
📆 Previous Year Numbers – Enter historical performance for benchmarking
📘 KPI Definition Sheet – Set formula, type, and details for every KPI
🛠️ How to Use the Dashboard
1️⃣ Open the Dashboard File
Enable editing and macros (if prompted), although this version runs entirely on formulas—no VBA required.
2️⃣ Set Up Your KPIs
In the KPI Definition tab, enter your KPIs, formulas, units, and performance type (UTB or LTB).
3️⃣ Enter Data Monthly
Log your MTD/YTD values in the Actuals sheet and update the Target and PY sheets as needed.
4️⃣ Monitor the Dashboard
Go to the Dashboard tab and select any month. Instantly see visual comparisons and performance indicators.
5️⃣ Use the KPI Trend Sheet
Analyze the performance of any single KPI over time to spot trends, growth, or concerns.
👥 Who Can Use This Excel Template?
🚛 Supply Chain Managers – Track logistics KPIs for growth
🏬 Retail Operations Teams – Analyze fulfillment rates and inventory
🏗️ Manufacturers – Monitor production output and delivery lead times
📦 Warehousing Teams – Measure space utilization and order processing
📈 Logistics Consultants – Use for client performance reports
🛍️ E-Commerce and Distribution Networks – Analyze performance regionally
🔗 Click here to read the Detailed blog post
📺 Visit our YouTube channel to learn step-by-step video tutorials


Reviews
There are no reviews yet.