In today’s competitive market, delayed shipments, stockouts, or overstocking can cost your business big. But what if you could track every critical supply chain metric in one smart dashboard — without paying for expensive software?
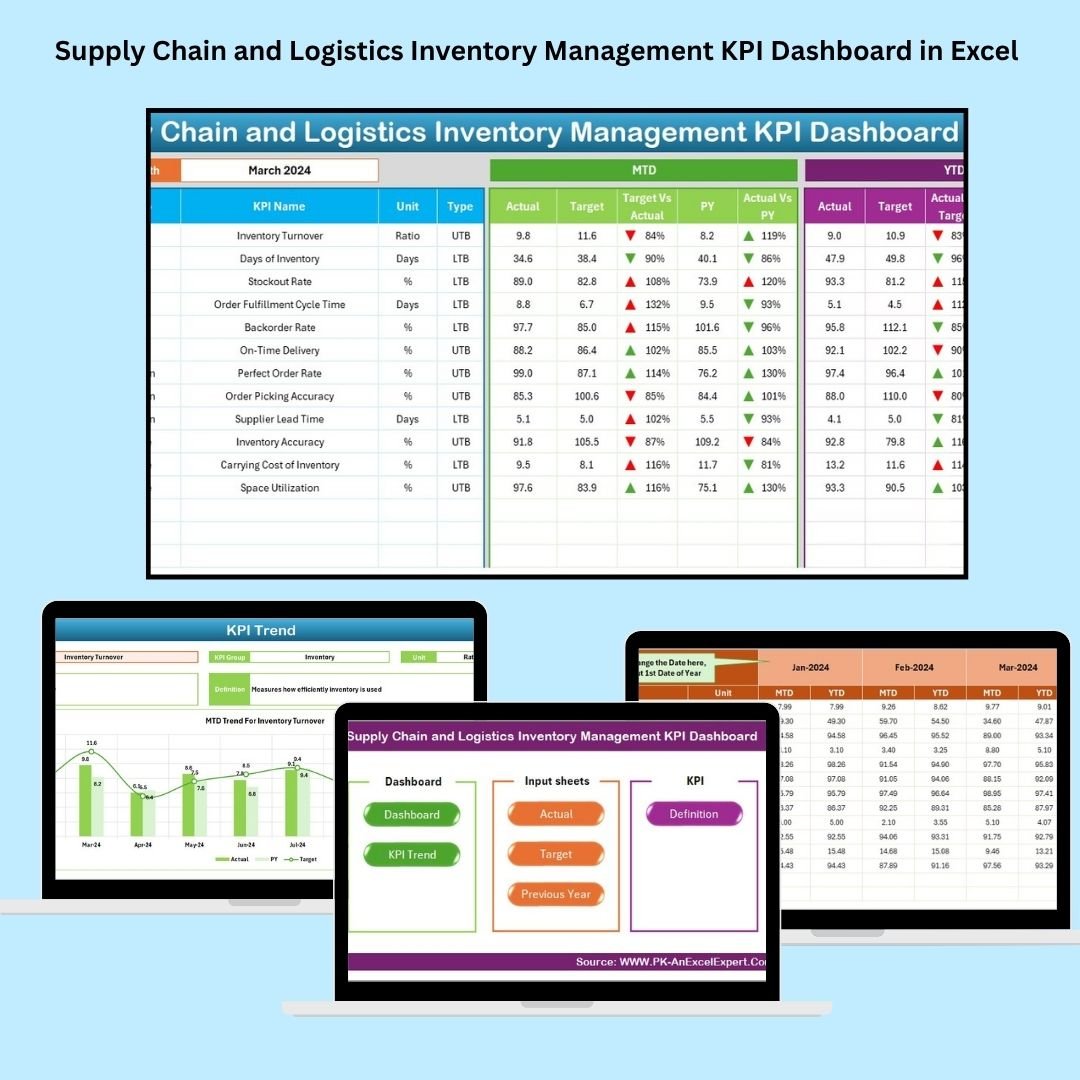
Introducing the Supply Chain and Logistics Inventory Management KPI Dashboard in Excel — a powerful, plug-and-play Excel solution designed for logistics professionals, inventory teams, and business owners who want to drive decisions with data.
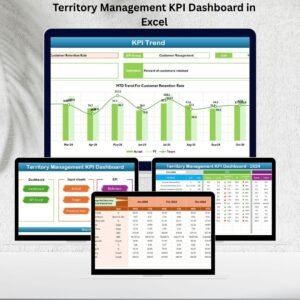
This interactive tool gives you full visibility into your supply chain performance through KPI tracking, dynamic visuals, and automated calculations — all with zero coding!
✨ Key Features of Supply Chain and Logistics KPI Dashboard in Excel
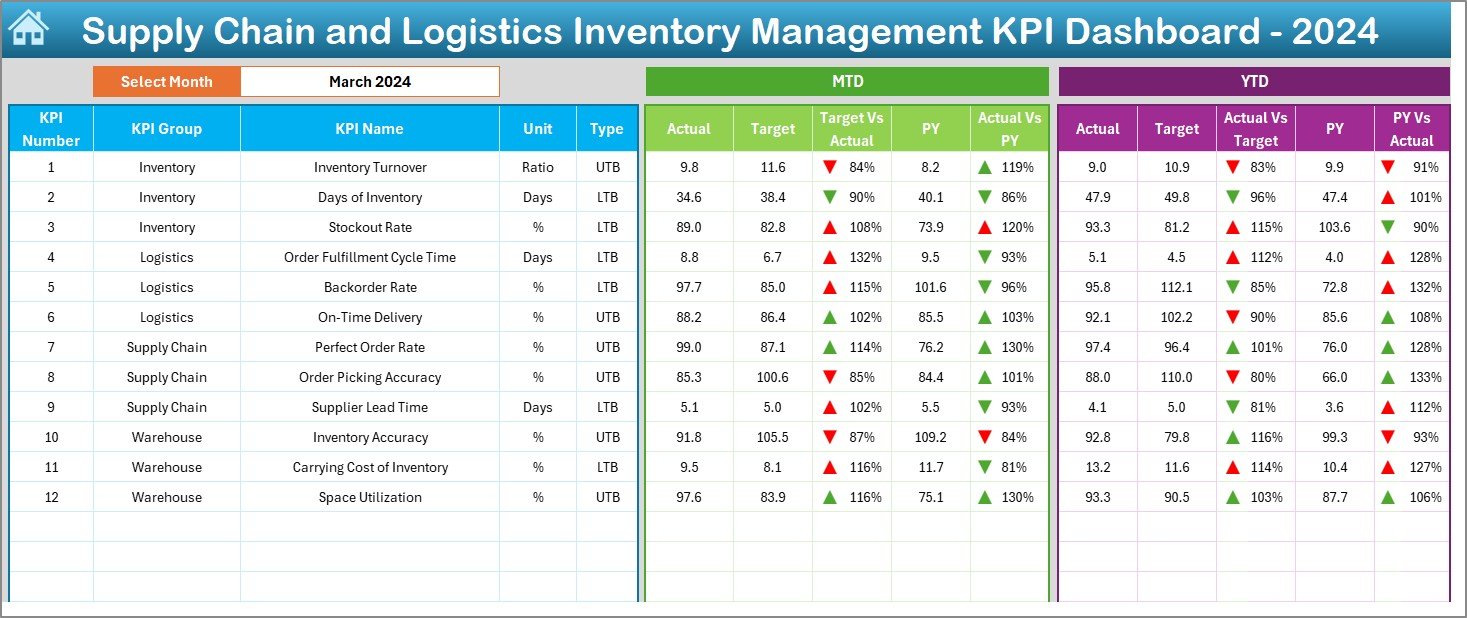
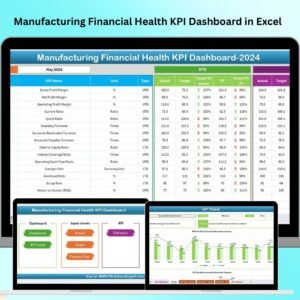
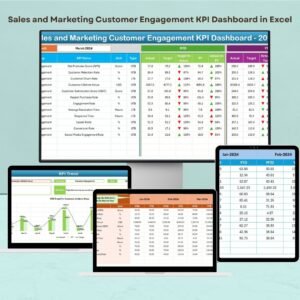
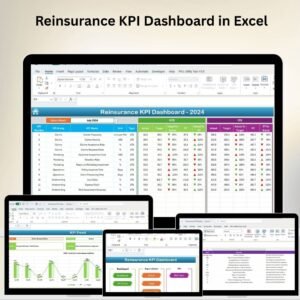
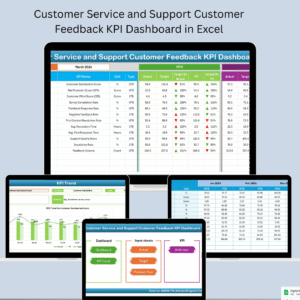
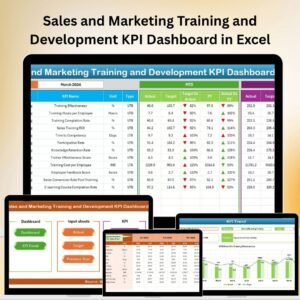
📊 Dynamic KPI Dashboard
Visualize MTD, YTD, and Previous Year metrics with interactive dropdowns and auto-updating charts.
🧮 Automated Calculations
Built-in formulas auto-calculate performance gaps and comparisons. No manual work needed!
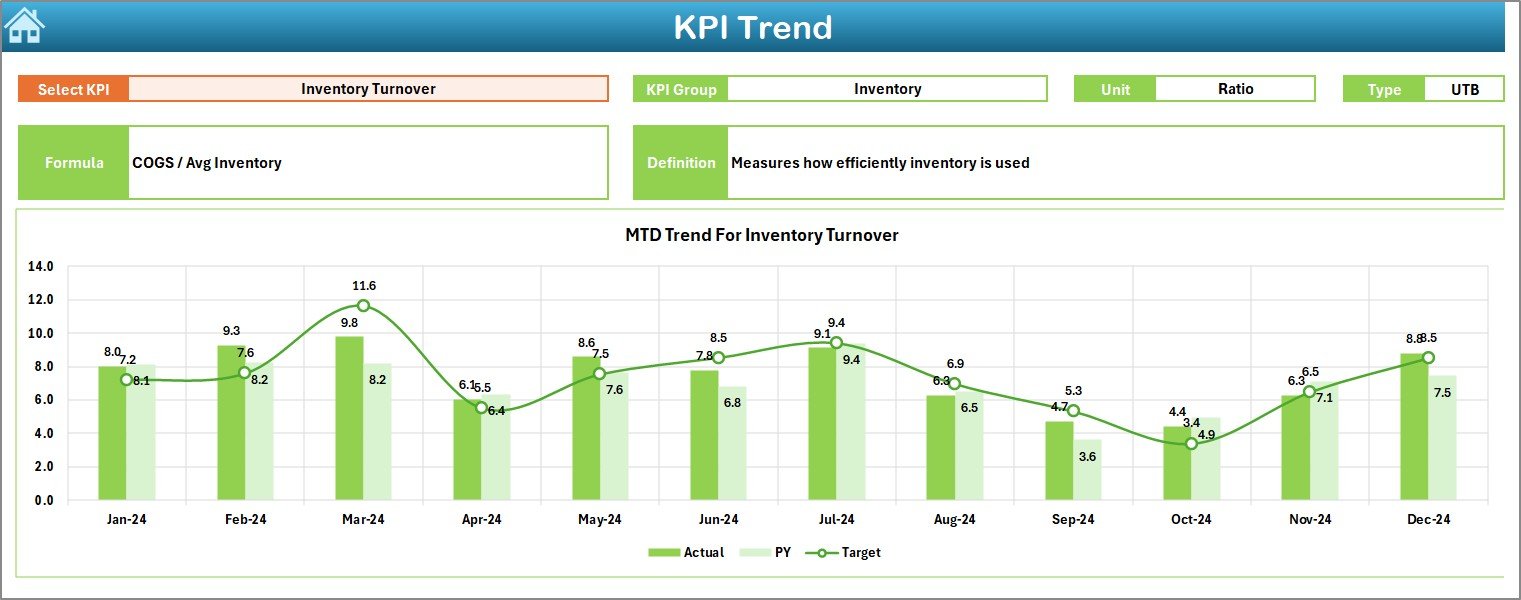
📈 KPI Trend Analyzer
Track trends for each KPI over time. Select any metric and view detailed performance insights and charts.
🔄 Real-Time Data Integration
Input monthly actuals and targets. The dashboard updates automatically to reflect your latest numbers.
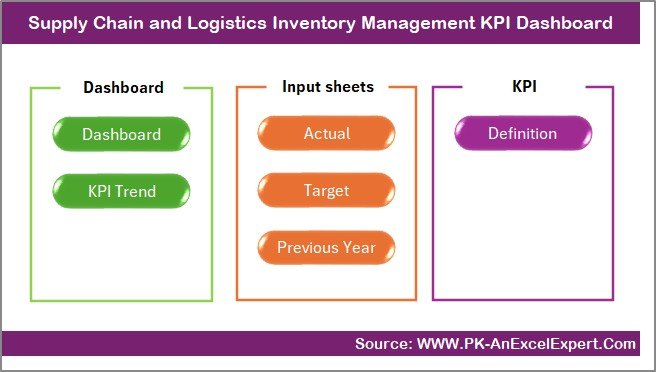
📁 Seven Organized Worksheets
Everything you need — Dashboard, KPI Trend, Targets, Input Sheet, PY Sheet, Definitions, and Home Sheet — is just one click away.
🔗 Navigation Buttons for Easy Access
Quickly jump between sheets using the Home tab — designed for intuitive, fast navigation.
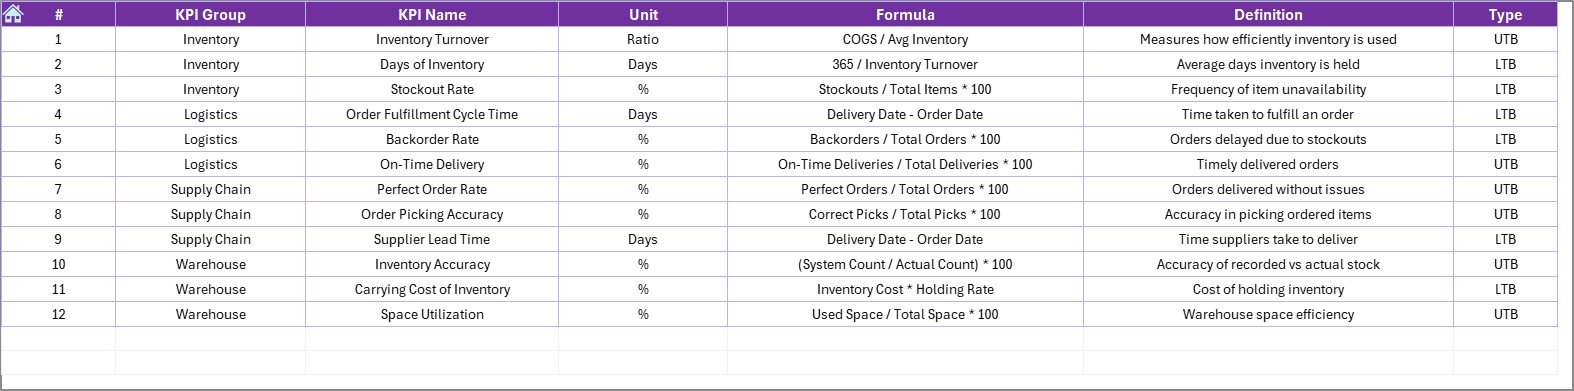
📋 KPI Encyclopedia Included
Each KPI is defined with formula, unit, and performance rule (UTB or LTB). No more confusion across teams!
📂 What’s Inside the Dashboard
🟢 Home Sheet – Central navigation hub with buttons for each tab
📊 Dashboard Sheet – Auto-updating visual dashboard with arrows, trends, and summaries
📉 KPI Trend Sheet – In-depth analysis for individual KPIs with line charts and meta data
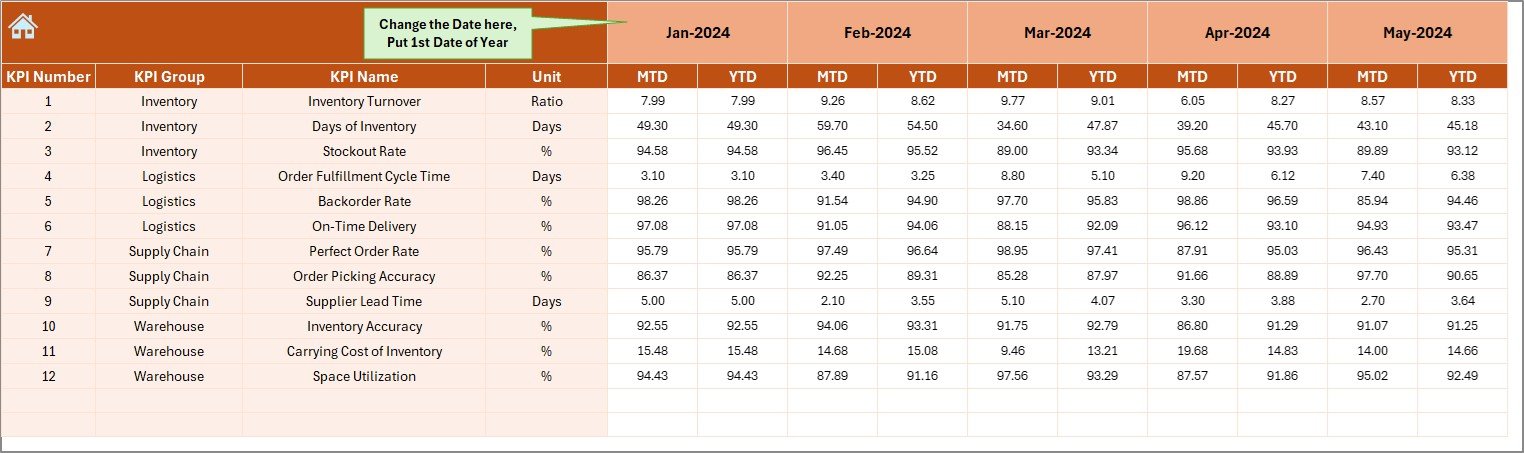
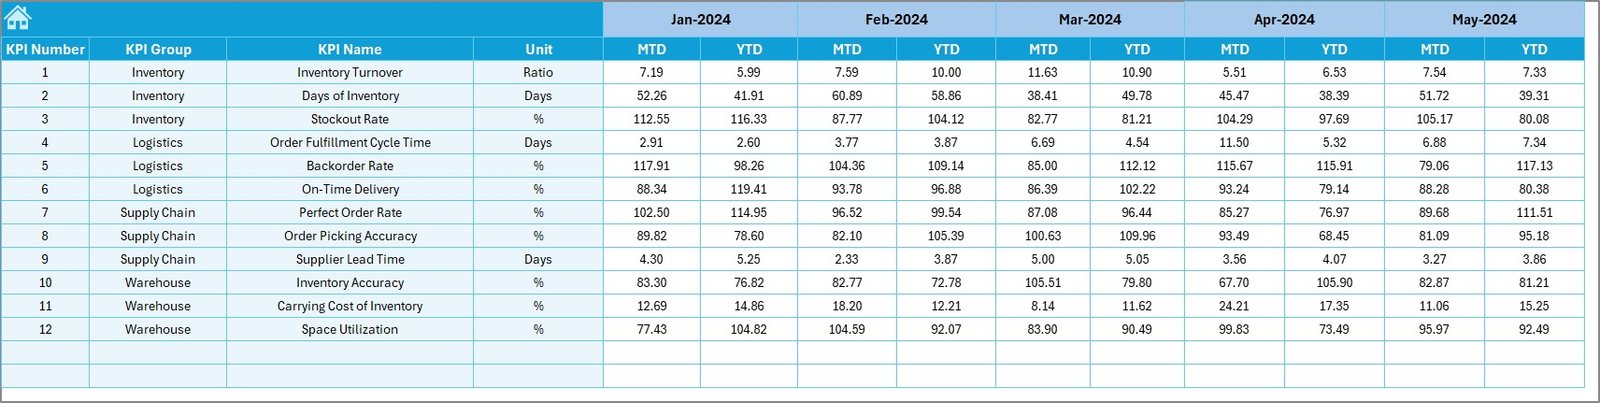
✏️ Actual Numbers Input Sheet – Enter monthly actuals with MTD and YTD values
🎯 Target Sheet – Log performance goals for comparison
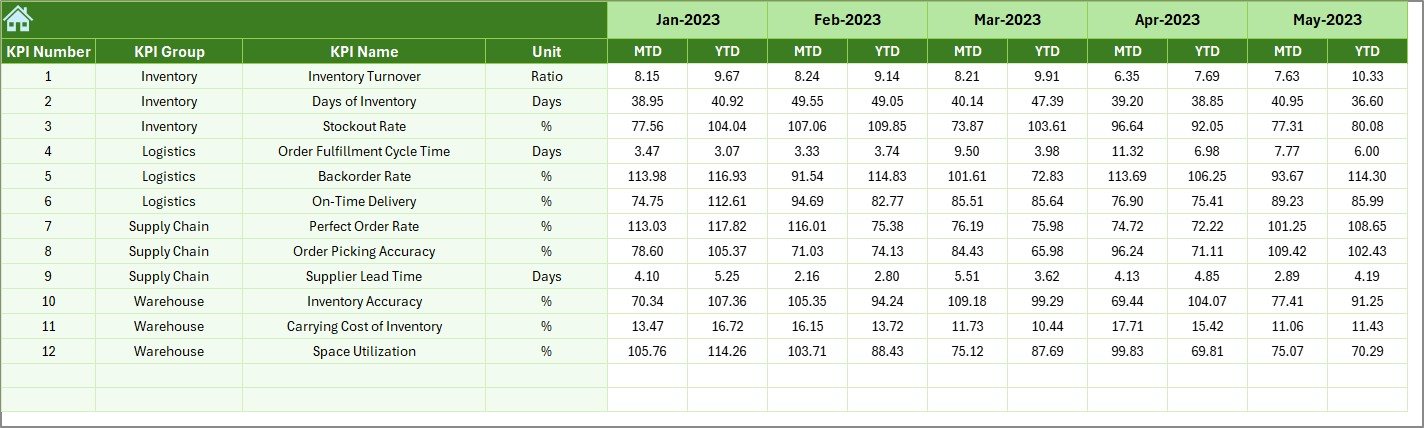
📆 Previous Year Sheet – Store last year’s data to benchmark growth
📘 KPI Definition Sheet – View formulas, units, types, and definitions for each metric
🛠️ How to Use the KPI Dashboard
1️⃣ Open the Home Sheet
Start with the navigation screen and jump to any part of the dashboard.
2️⃣ Enter Actual Data
Head to the Input Sheet and log MTD and YTD values monthly.
3️⃣ Set Monthly Targets
Enter your target values on the Target Sheet — the dashboard will do the rest.
4️⃣ Add PY Numbers
Update the Previous Year tab to compare current vs. past performance.
5️⃣ Review KPIs in the Dashboard
View your performance instantly with charts, color indicators, and arrows.
6️⃣ Zoom In Using KPI Trend Sheet
Want to focus on one KPI? Analyze it in detail with visual trends.
👥 Who Can Benefit from This Excel Dashboard?
🚚 Supply Chain Managers – Track order fulfillment, returns, and logistics flow
🏬 Inventory Analysts – Monitor stock levels, turnover, and reorder rates
🏭 Manufacturing Units – Measure supplier lead time and production delays
🛍️ Retail Chains – Manage space utilization and perfect order rate
📦 Warehouse Teams – Spot inefficiencies and reduce carrying costs
📈 Small Businesses – Get enterprise-level tracking in a budget-friendly Excel tool
🔗 Click here to read the Detailed blog post
📺 Visit our YouTube channel to learn step-by-step video tutorials


Reviews
There are no reviews yet.