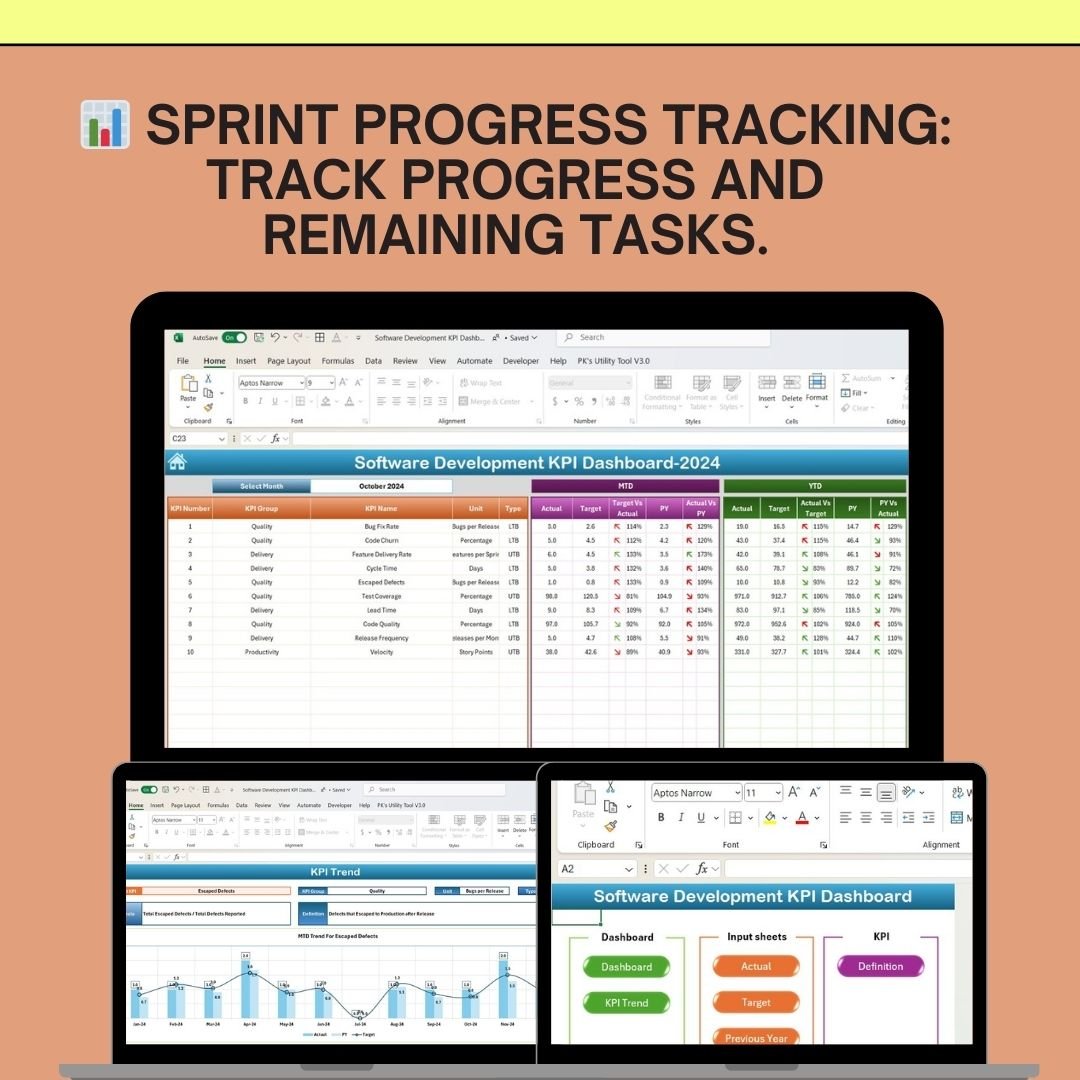


The Software Development KPI Dashboard in Excel is a comprehensive tool designed to help software development teams and project managers track and monitor the performance of their development processes. This Excel-based dashboard provides key performance indicators (KPIs) that are essential for assessing the effectiveness of development cycles, improving team productivity, and ensuring the timely delivery of software products.
With its detailed metrics, you can track project progress, sprint velocity, defect rates, deployment frequency, and other critical factors, allowing you to optimize your development workflows and make informed decisions to enhance overall team performance.
Key Features of the Software Development KPI Dashboard in Excel
📊 Sprint & Project Progress Tracking
Track the progress of your software development projects and sprints. Visualize the percentage of tasks completed versus remaining, ensuring you’re on track to meet deadlines.
🖥 Velocity Tracking
Measure sprint velocity to evaluate the team’s ability to complete tasks over a defined period. This helps in forecasting future sprint planning and identifying areas for improvement.
🔧 Defect Tracking & Management
Monitor defect rates, including critical, major, and minor bugs. Analyze defect trends over time to identify areas of the development process that may require improvements.
📦 Deployment Frequency
Track how often new features and fixes are deployed to production. Measure deployment frequency to ensure efficient software delivery and continuous improvement.
📅 Lead & Cycle Time Tracking
Monitor lead time (the time it takes to start working on a feature) and cycle time (the time it takes to complete a feature), helping you understand how long it takes to get from planning to production.
⚙️ Customizable & Scalable Dashboard
Tailor the dashboard to your team’s specific development process. Add custom KPIs, update progress indicators, and adjust data tracking categories as needed.
Why You’ll Love the Software Development KPI Dashboard in Excel

✅ Optimize Development Workflows
Monitor sprint progress, deployment frequency, and defect rates to improve the efficiency of your development process and optimize resource allocation.
✅ Improve Team Performance
Track velocity and completion rates to better understand your team’s capabilities. Use this data to identify bottlenecks and streamline workflows for greater productivity.
✅ Reduce Defects & Bugs
By tracking defects over time, you can identify common causes, fix recurring issues, and improve the quality of your software products.
✅ Ensure Timely Delivery of Features
Track deployment frequency to measure the speed of your delivery pipeline and ensure that new features and bug fixes are deployed regularly and efficiently.
✅ Customizable & Scalable
Adapt the dashboard to match your team’s unique development process. Whether you’re managing a small team or large-scale projects, this dashboard scales to your needs.
What’s Inside the Software Development KPI Dashboard in Excel?
-
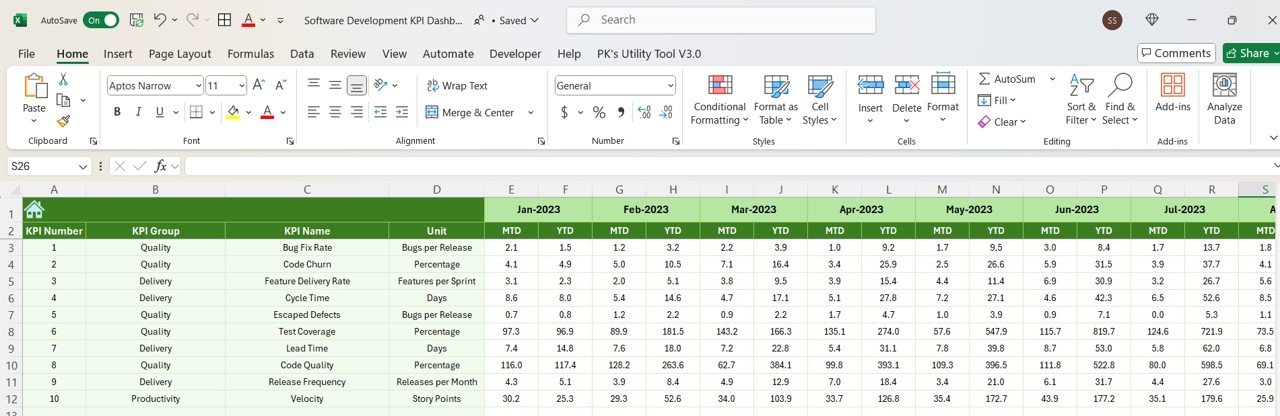
Sprint & Project Progress Tracking: Visualize sprint progress and task completion.
-
Velocity Tracking: Measure sprint velocity to forecast team capacity.
-
Defect Tracking & Management: Track bug reports and resolution rates.
-
Deployment Frequency: Monitor the frequency of deployments to production.
-
Lead & Cycle Time Tracking: Measure the time taken for feature delivery.
-
Customizable KPIs: Adjust the dashboard to suit your development process.
How to Use the Software Development KPI Dashboard in Excel
1️⃣ Download the Template: Access the Software Development KPI Dashboard in Excel instantly.
2️⃣ Input Your Development Data: Add your project data, including sprint progress, velocity, and defect reports.
3️⃣ Track KPIs & Metrics: Monitor key metrics such as sprint velocity, defects, and lead time.
4️⃣ Analyze Progress & Identify Bottlenecks: Use time-based analysis to identify areas for improvement and optimize team performance.
5️⃣ Optimize Your Development Process: Use the insights from the dashboard to streamline workflows, reduce defects, and ensure timely delivery.
Who Can Benefit from the Software Development KPI Dashboard in Excel?
🔹 Software Development Teams
🔹 Project Managers & Scrum Masters
🔹 IT Operations & Development Managers
🔹 Quality Assurance Teams
🔹 Product Development Teams
🔹 Small & Medium Enterprises (SMBs)
🔹 Large Corporations with Software Development Operations
Optimize your software development process with the Software Development KPI Dashboard in Excel. Track project progress, improve team performance, and ensure timely delivery—all in one easy-to-use tool.
Click here to read the Detailed blog post
Visit our YouTube channel to learn step-by-step video tutorials
Youtube.com/@PKAnExcelExpert


Reviews
There are no reviews yet.