


🔑 Key Features of Small Business CFO Dashboard in Google Sheets
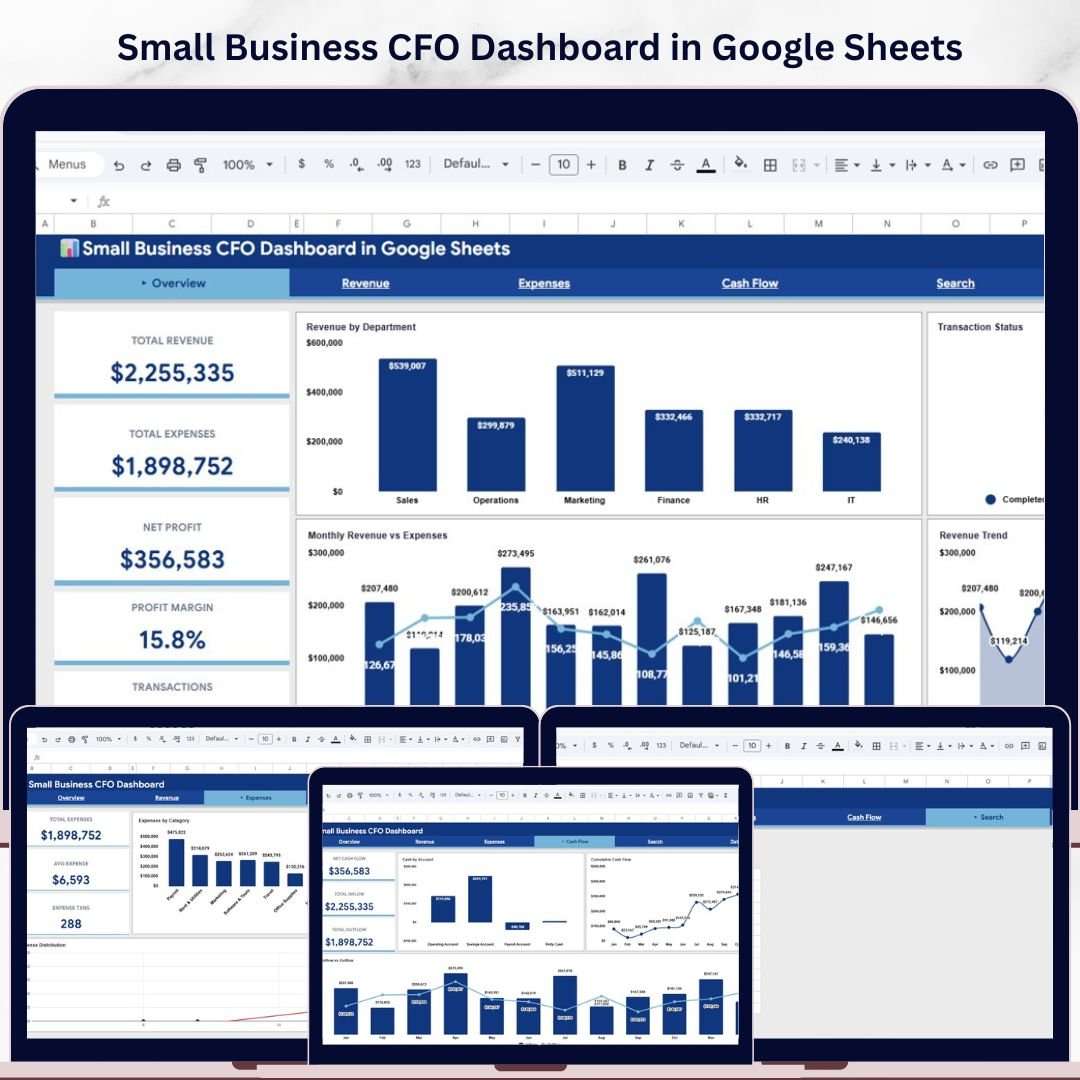
Small Business CFO Dashboard in Google Sheets is a professionally designed financial management template built for small business owners, CFOs, finance managers, and bookkeepers who need a clear, real-time view of their company’s financial health. This dashboard includes 6 interactive pages covering revenue tracking, expense analysis, cash flow monitoring, and transaction search — all powered by Google Sheets formulas and charts that update automatically when you enter your data.
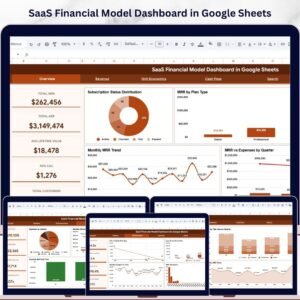
This template tracks 5 critical financial KPIs on the Overview page: Total Revenue, Total Expenses, Net Profit, Profit Margin, and Transactions. With built-in slicers and filters, you can quickly slice and dice your financial data by department, category, payment method, and time period without any manual effort. Whether you are managing a startup or a growing small business, this Google Sheets dashboard template gives you CFO-level insights without the complexity of enterprise software.
 Small Business CFO Dashboard in Google Sheets
📦 What’s Inside the Small Business CFO Dashboard
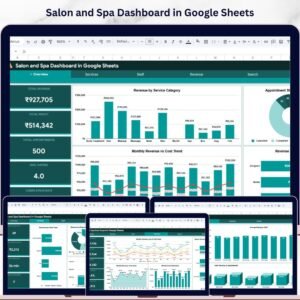
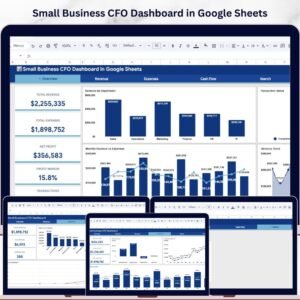
📊 Overview Page — The main command center displays 5 high-level KPI cards: Total Revenue, Total Expenses, Net Profit, Profit Margin, and Transactions. It also features powerful charts including Revenue by Department to compare financial performance across business units, Monthly Revenue vs Expenses for side-by-side trend comparison, Transaction Status by Category to monitor pending, completed, and cancelled transactions, and Revenue Trend by Month to spot seasonal patterns. Multiple slicers let you filter the entire dashboard instantly.
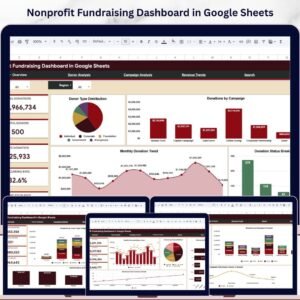
💰 Revenue Page — Deep-dive into your income streams with Revenue by Category, Revenue by Payment Method, and Quarterly Revenue analysis. Understand exactly where your money is coming from and which payment channels drive the most business.
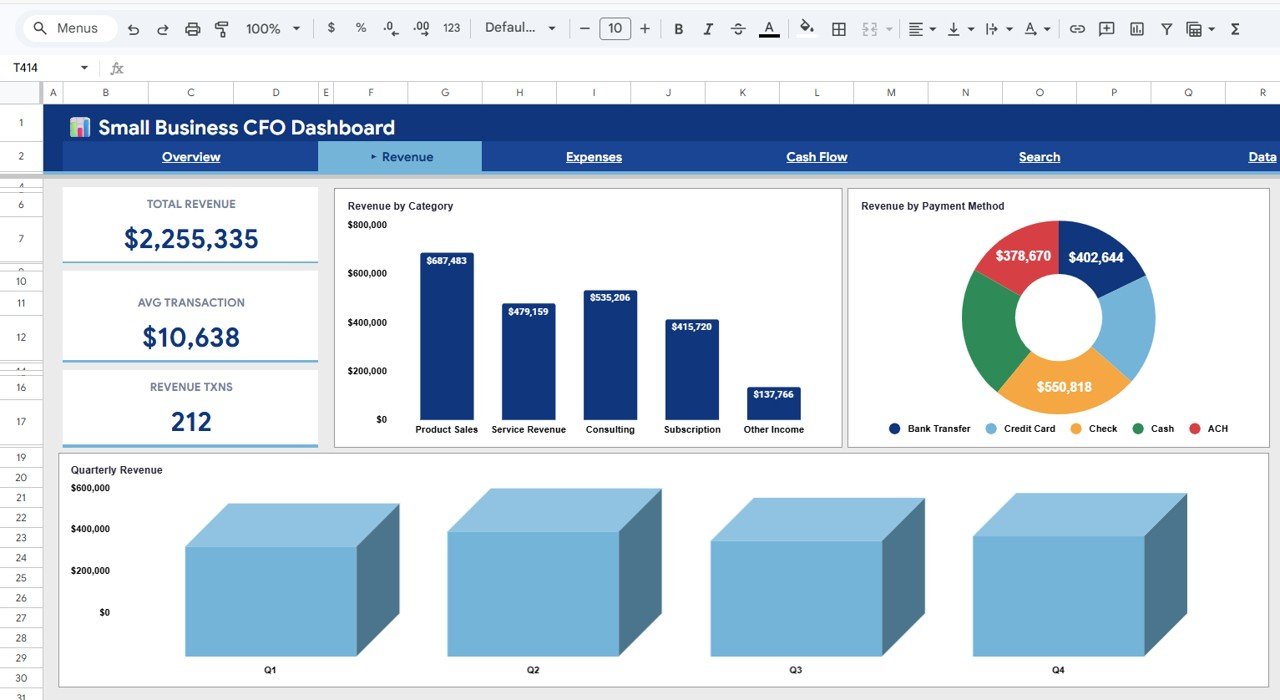 Revenue Analysis Page
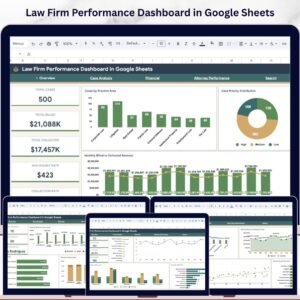
📉 Expenses Page — Get full visibility into your spending with Expenses by Category, Expenses by Department, and Expense Distribution by Time. Identify cost-saving opportunities and keep your budget under control.
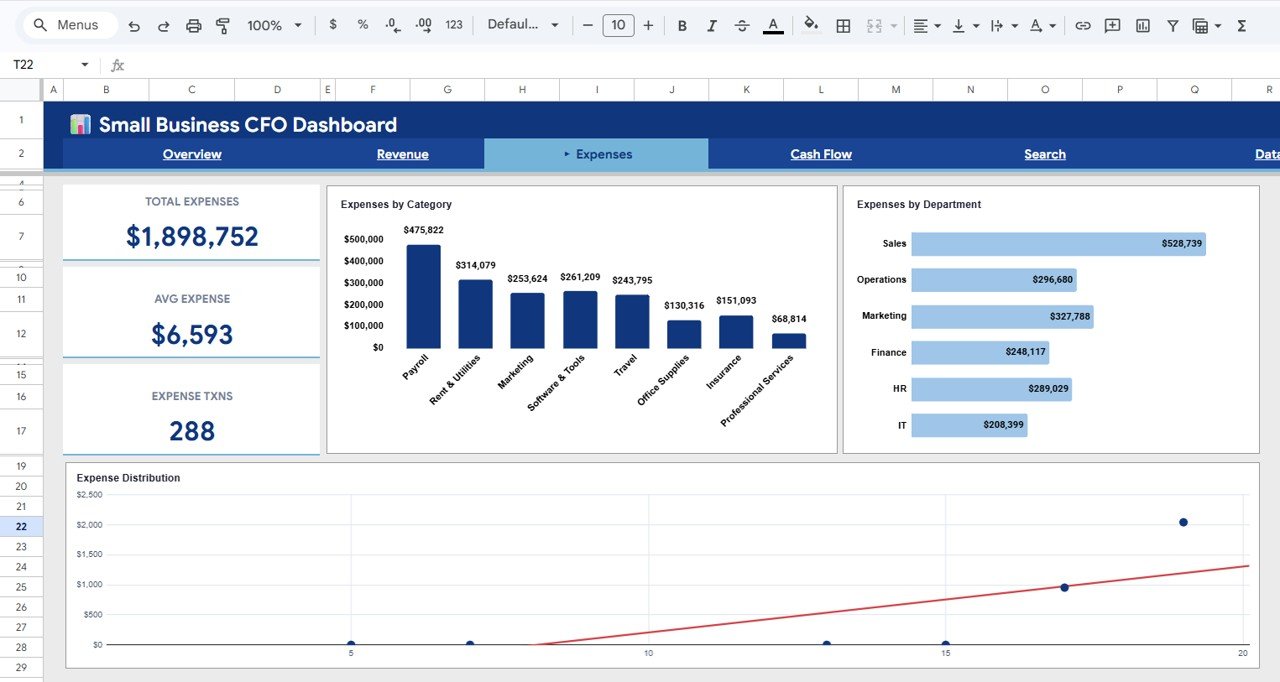 Expenses Analysis Page
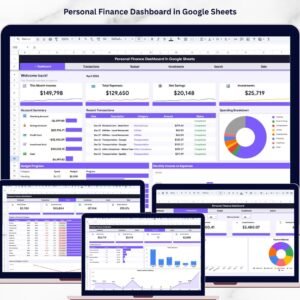
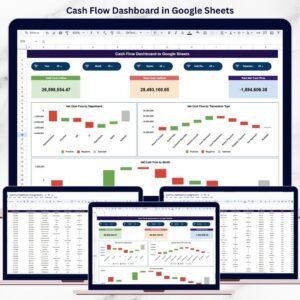
💵 Cash Flow Page — Monitor your liquidity with Cash by Account, Cumulative Cash Flow by Month, and Monthly Inflow vs Outflow charts. Never be surprised by a cash crunch again. This is similar to what you would find in the Financial Transactions Dashboard in Google Sheets.
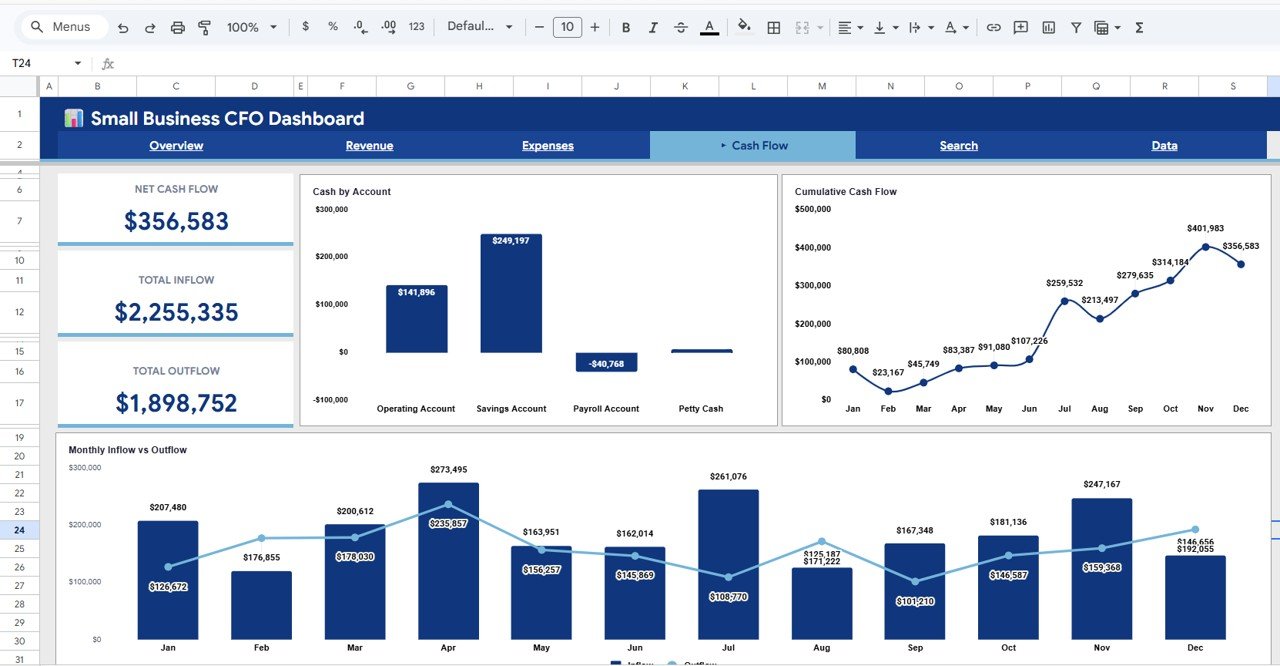 Cash Flow Analysis Page
🔍 Search Page — Look up any transaction instantly by selecting a Transaction ID from the dropdown. It displays all details including Date, Category, Sub-Category, Department, Type, Revenue, Expense, Profit, Payment Method, Vendor or Customer, Status, and Account.
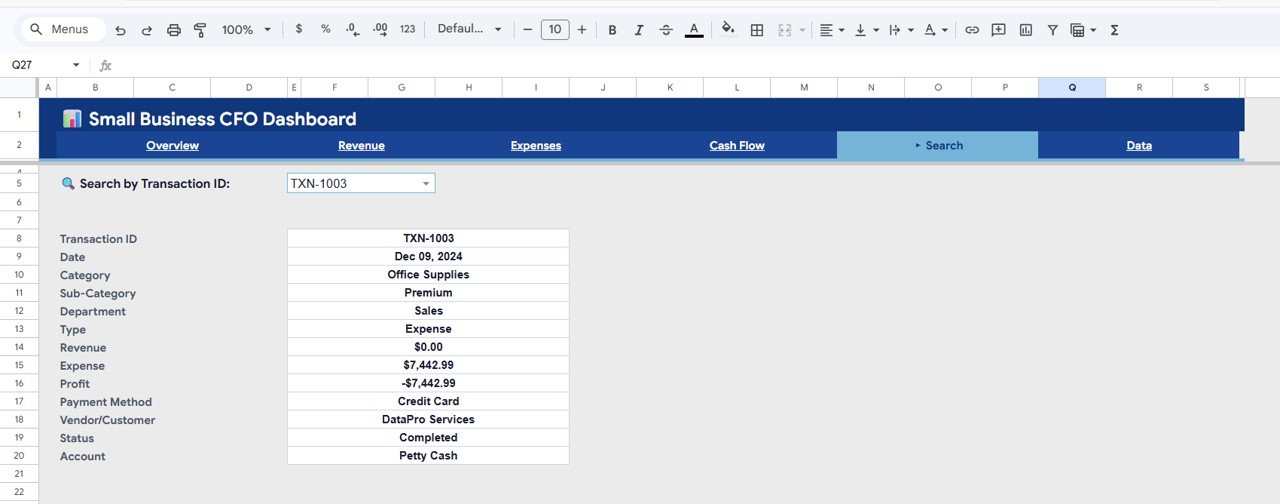 Search Sheet Tab
📝 Data Sheet — Simply enter your financial transactions in the structured data sheet and all dashboard pages update automatically. No formulas to write, no manual charting needed.
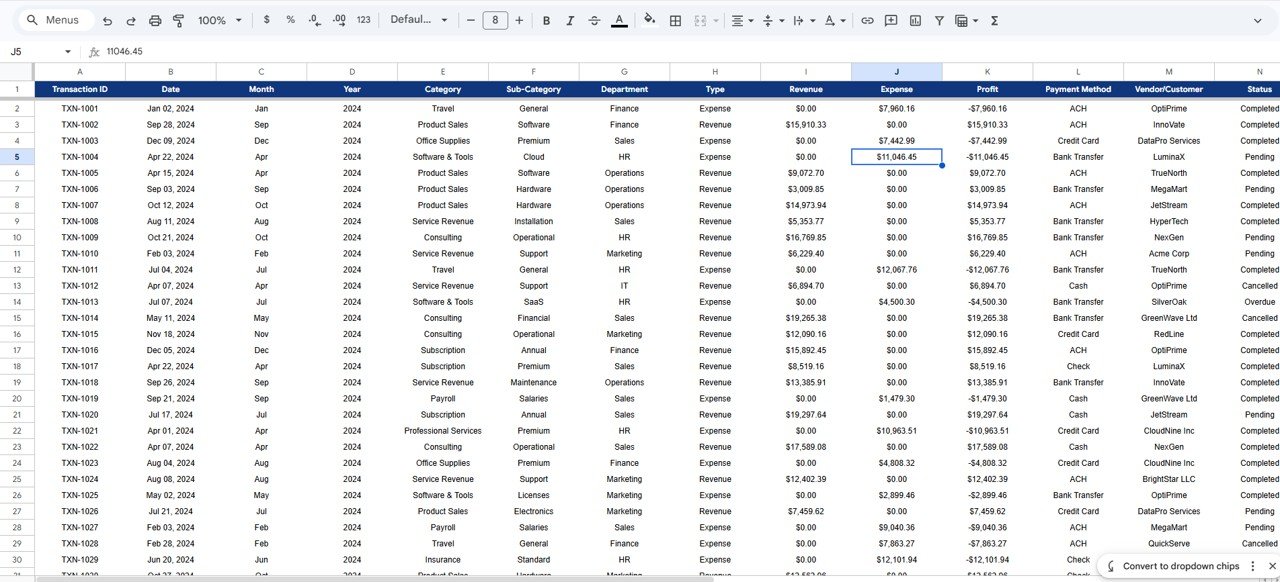 Data Sheet Tab
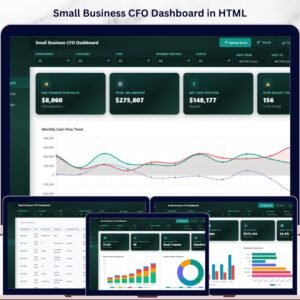
If you need a more advanced version, check out the Small Business CFO Dashboard in Power BI or the Small Business CFO Dashboard in HTML for interactive browser-based analytics.
⚙️ How to Use the Small Business CFO Dashboard
1️⃣ Purchase and download the template, then open the PDF guide to find the Google Sheets copy link.
2️⃣ Click the link to create your own editable copy in Google Drive — your data stays private and secure.
3️⃣ Navigate to the Data sheet tab and replace the sample data with your actual financial transactions, keeping the same column format.
4️⃣ Switch to the Overview, Revenue, Expenses, and Cash Flow pages to see your dashboard come alive with real-time charts and KPIs.
5️⃣ Use the slicers and filters on the Overview page to drill down into specific departments, categories, or time periods.
6️⃣ Use the Search page to quickly look up any individual transaction by its ID.
👥 Who Can Benefit from This Dashboard
🔹 Small Business Owners who want a simple yet powerful financial overview without hiring a full-time CFO
🔹 Startup Founders tracking revenue growth, burn rate, and cash runway
🔹 Freelancers and Consultants managing income, expenses, and profit margins across multiple clients
🔹 Finance Managers and Bookkeepers who need a visual reporting layer on top of raw transaction data
🔹 Non-Profit Administrators monitoring fund inflows, outflows, and budget utilization
🔹 Students and Educators learning financial analysis and dashboard design in Google Sheets
❓ Frequently Asked Questions
What KPIs does the Small Business CFO Dashboard in Google Sheets track?
The Small Business CFO Dashboard in Google Sheets tracks 5 key performance indicators: Total Revenue, Total Expenses, Net Profit, Profit Margin, and total Transactions. These KPIs are displayed as cards on the Overview page and update automatically from your data.
Do I need advanced Google Sheets skills to use this template?
No. Simply replace the sample data in the Data sheet with your own financial transactions and all 5 dashboard pages update automatically. No formulas or scripts to write.
Can I filter the dashboard by department or category?
Yes. The Overview page includes multiple slicers that let you filter the entire dashboard by department, category, payment method, and time period with a single click.
What is the best Google Sheets dashboard for small business financial tracking?
The Small Business CFO Dashboard in Google Sheets from NextGenTemplates is one of the best options. It includes 6 pages covering revenue, expenses, cash flow, and transaction search — all in a single ready-to-use Google Sheets file.
How do I track cash flow in Google Sheets?
The Cash Flow page in this dashboard shows Cash by Account, Cumulative Cash Flow by Month, and Monthly Inflow vs Outflow. Enter your transactions in the Data sheet and the cash flow analysis updates automatically.
Can I use this dashboard for multiple businesses?
Yes. You can create separate copies for each business using the Google Sheets copy link provided in the PDF guide. Each copy is independent and fully editable.
🔗 Explore Related Templates
📊 Small Business CFO Dashboard in Excel — The same CFO dashboard experience built for Microsoft Excel users with pivot tables and advanced charting.
📊 Finance & Accounting Command Center Bundle — Get 8 premium finance templates across Excel, Power BI, and Google Sheets in one value bundle and save over 60%.
📊 Financial Transactions Dashboard in Google Sheets — A complementary template focused on detailed transaction-level analysis and reporting.
📖 Click here to read the Detailed Blog Post
Watch the step-by-step video tutorial:


Reviews
There are no reviews yet.