


The robotics industry is all about precision, uptime, and innovation—and your data tracking should be no different. With our Robotics Industry KPI Dashboard in Google Sheets, you’ll get a powerful, ready-to-use template designed to monitor your key performance indicators (KPIs) without the need for expensive software or technical skills.
Whether you’re managing robotic production lines, monitoring downtime, or tracking cost-per-unit, this Google Sheets dashboard puts all your essential metrics in one visual, interactive, and customizable format.

⚙️ Key Features of Robotics Industry KPI Dashboard
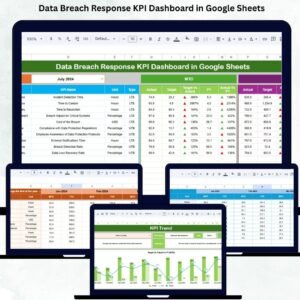
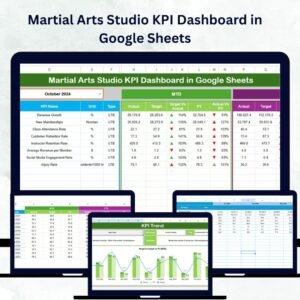
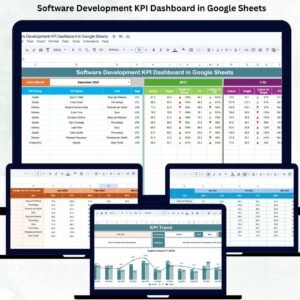
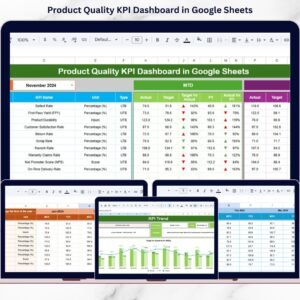
🖥️ Dashboard Sheet – Real-Time Performance at a Glance
-
Instantly view MTD (Month-to-Date) and YTD (Year-to-Date) metrics
-
Compare Actual vs Target and Actual vs Previous Year
-
Conditional formatting with 🔼🔽 arrows shows real-time progress
-
Perfect for quick reporting and performance reviews
📈 KPI Trend Sheet – Track Long-Term Performance
-
Select any KPI from the dropdown
-
View KPI Group, Unit, Type (LTB/UTB), Formula, and Definition
-
Identify monthly and yearly trends using interactive graphs
📝 Actual Number Sheet – Live Data Entry
-
Input real performance data for selected month (E1)
-
Updates all dashboard visuals automatically
-
Keeps your team aligned with the most current metrics
🎯 Target Sheet – Set Your Performance Benchmarks
-
Enter monthly and yearly goals for every KPI
-
Get immediate visibility into Target vs Actual performance
🕒 Previous Year Number Sheet – Track Year-Over-Year Progress
-
Store and compare previous year’s data
-
See how your robotics performance has evolved over time
📘 KPI Definition Sheet – Maintain KPI Clarity
-
Detailed KPI definitions with formula, unit, and purpose
-
Ensures all stakeholders are aligned and informed
📦 What’s Inside the Robotics KPI Dashboard?
-
✅ 6 Sheets: Dashboard, KPI Trend, Actuals, Targets, PY Numbers, Definitions
-
📊 Automated charts and tables with slicers and dropdowns
-
🔄 Real-time data sync across all sheets
-
📥 Easy-to-edit fields—no coding or macros required
-
🌐 Fully cloud-based—accessible from anywhere with Google Sheets
🧠 How to Use the Robotics Industry KPI Dashboard
-
Input your monthly performance data in the Actual Number Sheet
-
Define your goals in the Target Sheet
-
Compare current vs past performance using the PY Sheet
-
Select KPIs in the Trend Sheet for deeper analysis
-
Use the Dashboard Sheet for reporting, reviews, and action plans
No installations. No scripts. Just plug in your numbers and go!
👥 Who Can Benefit from This Dashboard?
-
🤖 Robotics Factory Managers – Monitor uptime, efficiency, and production
-
🛠️ Engineering Teams – Track energy usage, error rates, and output quality
-
📈 Operations Heads – Optimize costs and downtime across lines
-
📊 Data Analysts – Discover trends and generate actionable insights
-
🚀 Startups & Innovators – Benchmark growth and scale operations smoothly
This dashboard is perfect for any robotics-driven operation looking to increase transparency, drive productivity, and make better decisions.
🔧 Best Practices for Using This Template
✅ Update data regularly for real-time accuracy
📉 Focus on critical KPIs like robot uptime, defects, and efficiency
📊 Leverage trend insights for predictive maintenance and cost saving
🔄 Review year-over-year data to assess growth
🧩 Customize easily to fit your unique robotic systems or processes
🔗 Click here to read the Detailed blog post
Watch the step-by-step video Demo:


Reviews
There are no reviews yet.