


The Risk Mitigation KPI Dashboard in Excel is an essential tool for businesses to monitor and improve their risk management strategies. By tracking key performance indicators (KPIs) like risk mitigation rate, mitigation time, and compliance rate, this dashboard helps businesses identify risks, assess mitigation effectiveness, and optimize their overall risk management practices. Whether you’re a risk manager, compliance officer, or senior executive, this dashboard offers a clear and data-driven overview of your organization’s risk mitigation efforts.
This ready-to-use Excel template is fully customizable, allowing you to tailor it to your organization’s specific risk management needs.

📊 What’s Inside the Risk Mitigation KPI Dashboard 📊
The Risk Mitigation KPI Dashboard is divided into multiple worksheets, each designed to track different aspects of risk mitigation:
-
Home Sheet Tab
-
Centralized Navigation: The Home Sheet serves as the dashboard’s hub, offering easy access to all other sections.
-
Quick KPI Overview: View a summary of key KPIs, including risk mitigation rates and trends.
-
-
Dashboard Sheet Tab
-
Key Metrics Visualization: Track essential KPIs like:
-
Risk Mitigation Rate: Percentage of identified risks that have been mitigated.
-
Mitigation Time: Time taken to mitigate risks, compared to set targets.
-
Compliance Rate: The percentage of compliance with risk mitigation strategies.
-
-
Month and Year Tracking: Monitor Month-to-Date (MTD) and Year-to-Date (YTD) data with comparison to targets and previous year data.
-
Conditional Formatting: Visual arrows indicate if the performance is meeting, exceeding, or missing the target for each KPI.
-
-
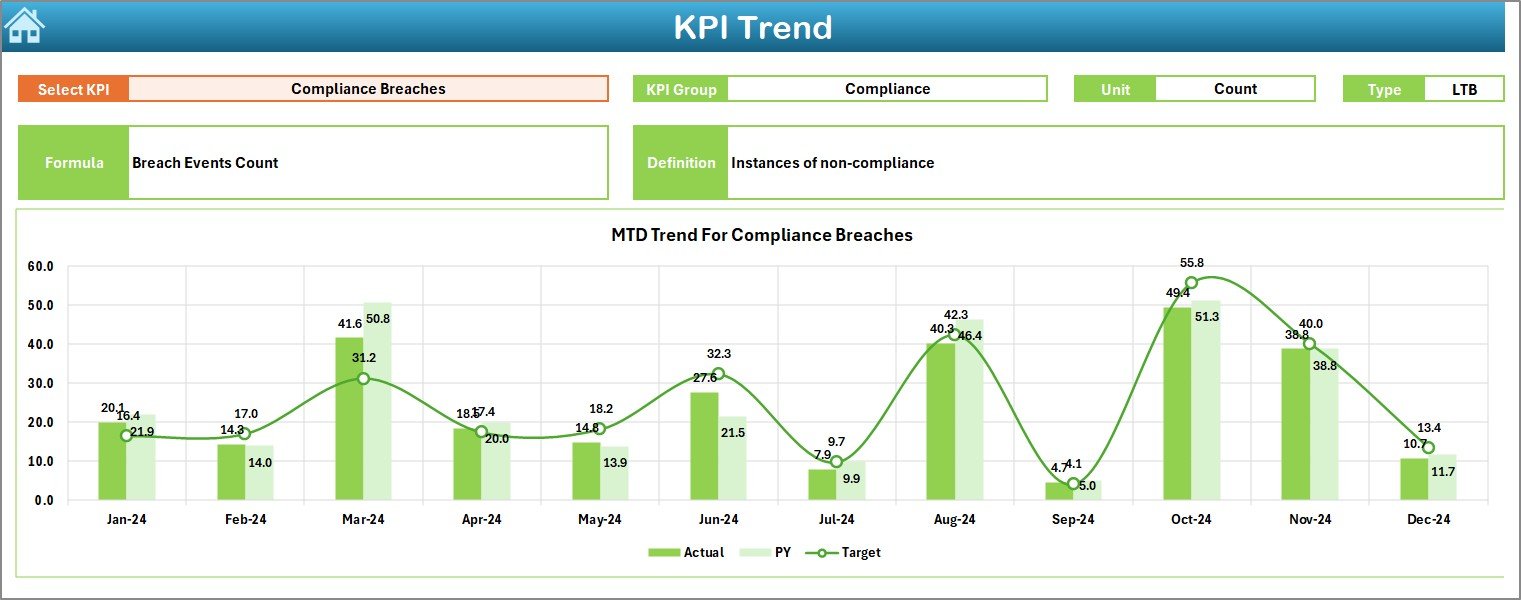
KPI Trend Sheet Tab
-
Trend Analysis: Track how KPIs have evolved over time, helping you analyze performance patterns.
-
Clear KPI Definitions: Understand how each KPI is measured, and review their formulas and units.
-
-
Actual Numbers Sheet Tab
-
Data Entry: Input actual performance data for MTD and YTD, allowing the dashboard to update automatically.
-
Automatic Data Update: Monthly data refreshes to ensure real-time updates on performance.
-
-
Target Sheet Tab
-
Target Management: Input target values for each KPI to measure actual performance against the goals set by your risk management strategy.
-
-
Previous Year Number Sheet Tab
-
Historical Comparison: Compare current data to last year’s figures, helping to identify trends and improvement opportunities.
-
-
KPI Definition Sheet Tab
-
Clear Definitions: Learn about each KPI with detailed explanations and how they are calculated to ensure clarity and transparency.
-
🛠️ How to Use the Risk Mitigation KPI Dashboard 🛠️
-
Input Data: Enter actual data for risk mitigation activities in the Actual Numbers Sheet.
-
Set Targets: Enter target values for each KPI in the Target Sheet to measure progress and set goals.
-
Track Progress: Use the Dashboard Sheet to see how well you’re meeting risk mitigation targets with visual charts and performance metrics.
-
Analyze Trends: Use the KPI Trend Sheet to spot performance patterns and areas for improvement.
💼 Who Can Benefit from This Risk Mitigation KPI Dashboard 💼
-
Risk Managers: Track key metrics to ensure that your organization’s risk management strategies are effective.
-
Compliance Officers: Measure compliance with internal and external risk mitigation policies.
-
Business Executives: Get an overview of your organization’s risk exposure and mitigation efforts to make data-driven decisions.
-
Project Managers: Monitor risk mitigation progress for specific projects, ensuring they are completed within budget and on schedule.
-
Auditors: Review historical and current data to assess the effectiveness of risk mitigation strategies.
🌟 Benefits of Using the Risk Mitigation KPI Dashboard 🌟
-
Centralized Risk Management: Keep all key performance indicators in one place for quick access and analysis.
-
Real-Time Data: Track your KPIs in real-time, allowing for immediate action to be taken on any identified risks.
-
Visual Insights: Use charts, graphs, and conditional formatting to quickly assess your organization’s risk management performance.
-
Data-Driven Decisions: Make informed decisions based on the most up-to-date risk data available.
-
Customizable: Fully customize the dashboard to meet your organization’s specific risk management needs and business goals.
Click here to read the detailed blog post
Watch the step-by-step video Demo:


Reviews
There are no reviews yet.