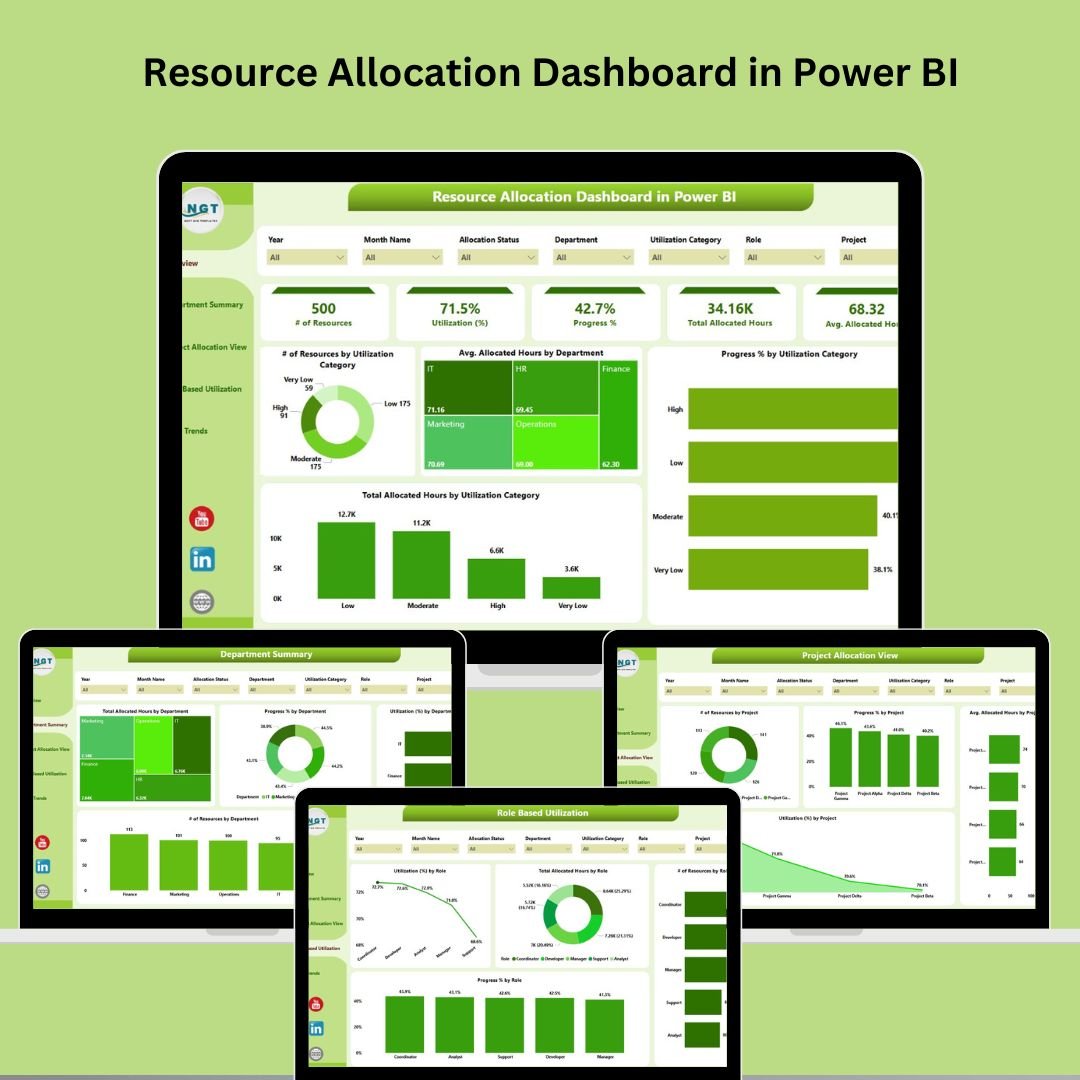
Managing people, projects, and departments across multiple teams? The Resource Allocation Dashboard in Power BI is your secret weapon for achieving smarter staffing, better planning, and higher productivity—all through intuitive, real-time visual analytics. 🚀
This ready-to-use Power BI dashboard empowers project managers, HR teams, and operations leaders with everything they need to allocate, track, and optimize resources in just a few clicks.
🔧 Key Features of the Resource Allocation Dashboard
🧭 5 Interactive Pages for 360° Resource Visibility
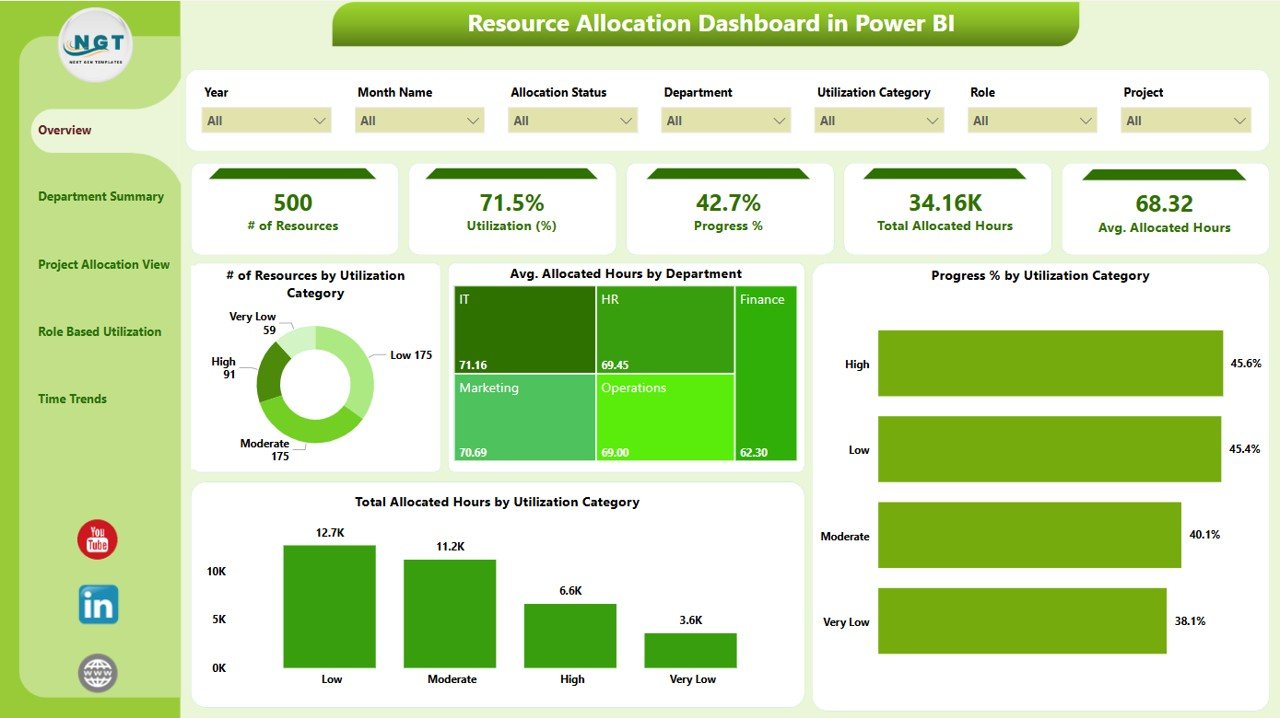
Overview Page
-
-
KPIs: Total Resources, Avg. Utilization %, Total Allocated Hours
-
Charts: Resources by Utilization Category, Hours by Department, and more
-
Filters: 7 slicers for instant drilldowns
-
-
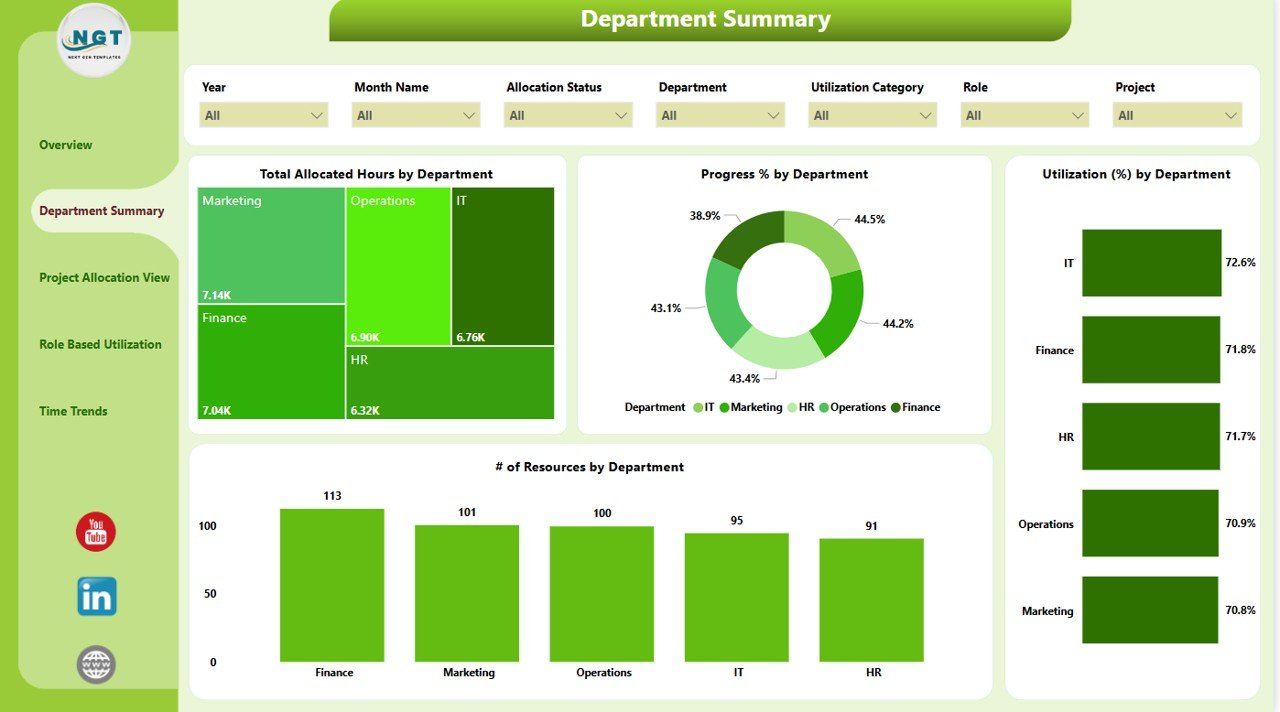
Department Summary
-
Compare resource use across departments
-
Visuals: Utilization %, Progress %, and Hours by Department
-
-
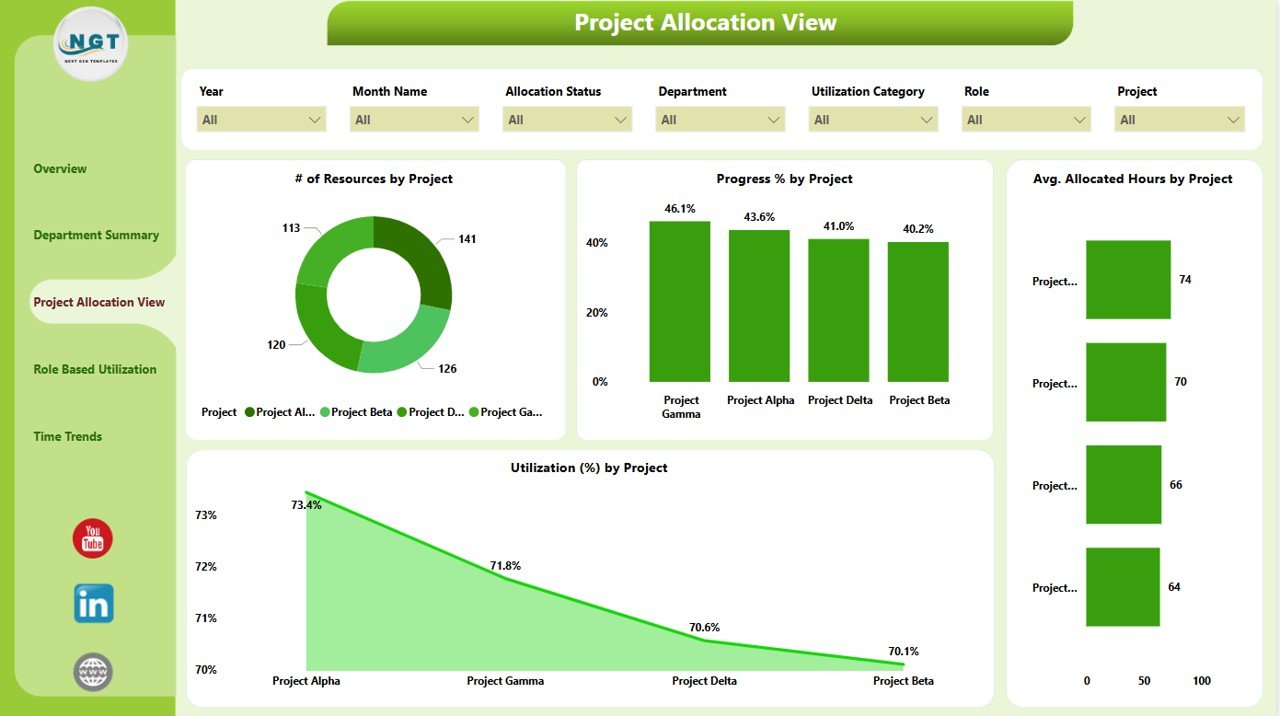
Project Allocation View
-
Track how resources are spread across projects
-
Monitor Average Hours, Resource Count, and Utilization % per project
-
-
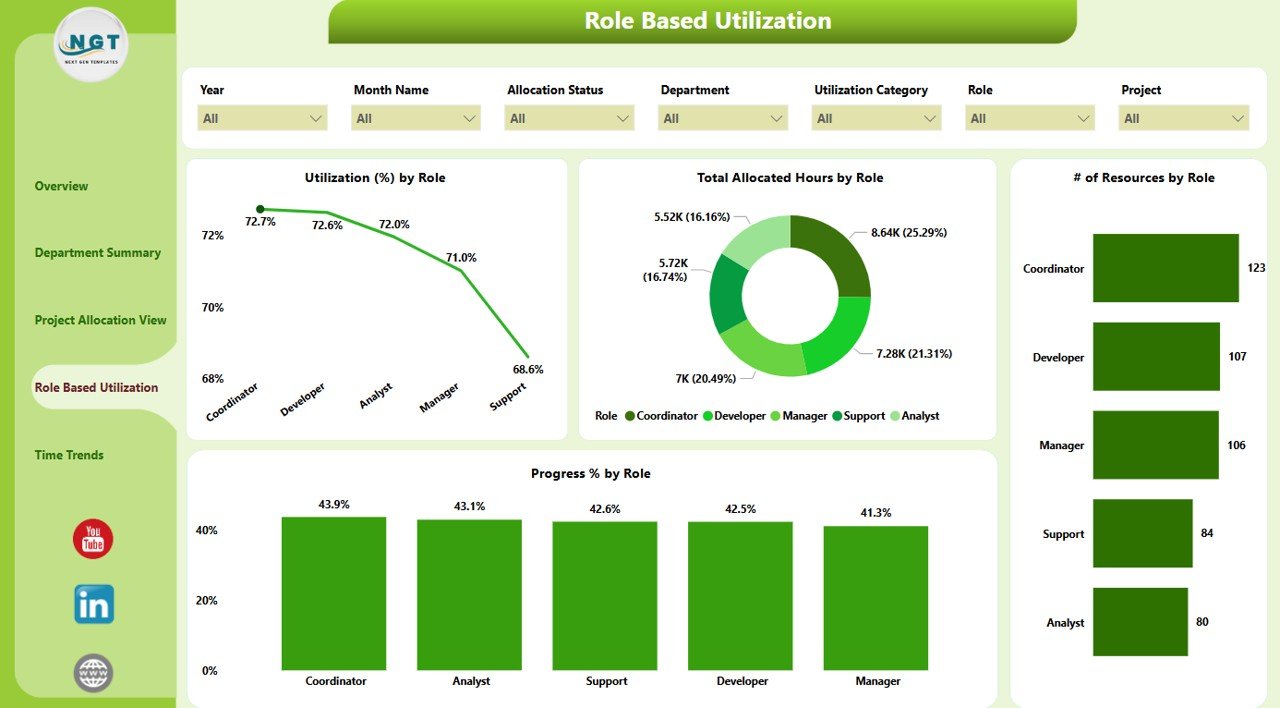
Role-Based Utilization
-
Understand how different roles perform
-
Find skill gaps or overused job functions using role-specific metrics
-
-
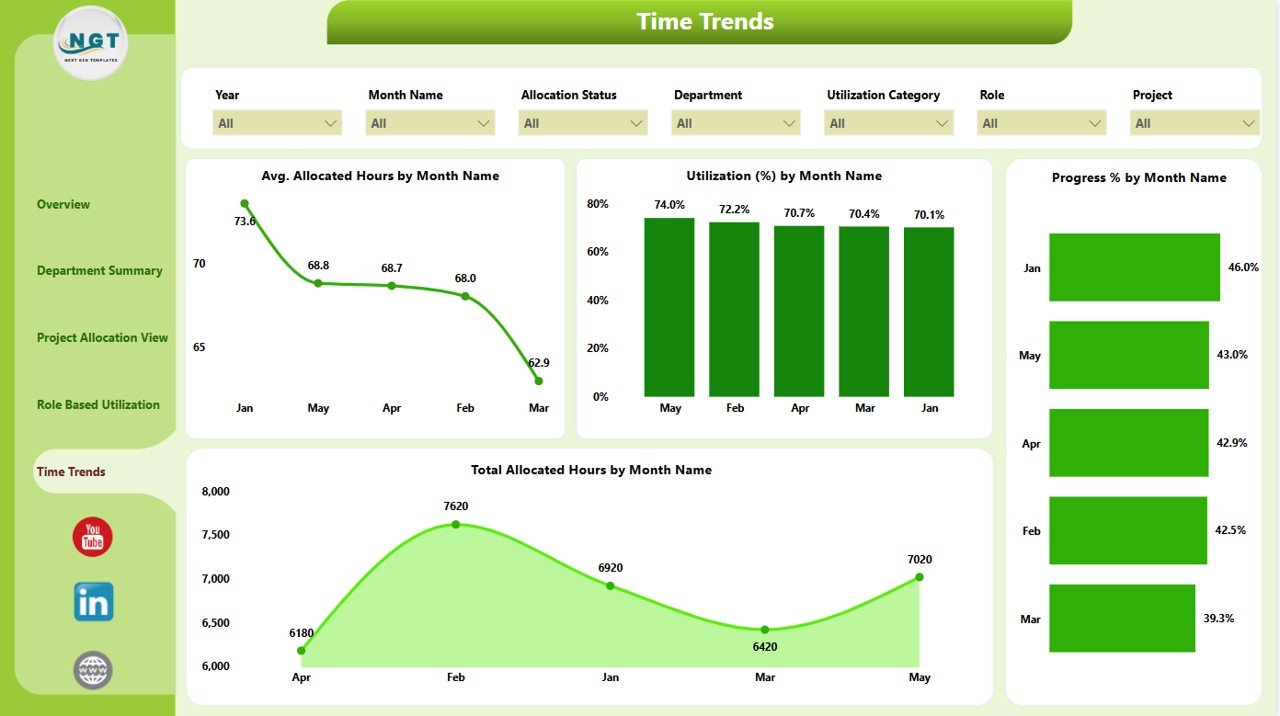
Time Trends
-
Spot seasonal patterns in resource use
-
Visualize Monthly Allocated Hours, Utilization %, and Progress %
-
📂 What’s Inside the Dashboard
Here’s what’s included in your download:
✅ A fully functional Power BI (.pbix) file
✅ 5 linked dashboard pages with dynamic filters
✅ Prebuilt charts, KPI cards, and slicers
✅ Sample data for learning and testing
✅ Clean layout and customizable design
✅ Support for Excel, SQL, and other data source connections
✅ Ready for publishing to Power BI Service or sharing internally
🛠️ How to Use the Resource Allocation Dashboard
🧾 Step 1: Connect Your Data
Import Excel or database files with fields like Resource Name, Project, Hours, Role, Department, and Utilization %.
🧮 Step 2: Review Metrics
Check KPIs like Total Allocated Hours, Utilization %, and Progress in the Overview tab.
📅 Step 3: Use Slicers
Filter views by role, time period, department, project, and more using 7 slicers per page.
📉 Step 4: Spot Bottlenecks
Identify overloaded teams or idle resources. Reassign or balance workloads accordingly.
🎨 Step 5: Customize as Needed
Add visuals, tweak colors, or modify formulas to align with your business KPIs.
📤 Step 6: Share with Teams
Publish to Power BI Service for team-wide access with role-level security.
👥 Who Can Benefit from This Dashboard?
This tool is perfect for:
👷 Project Managers – Allocate team members efficiently
💼 HR Professionals – Track talent utilization and identify gaps
🧠 Operations Leaders – Make strategic staffing decisions
💻 IT Departments – Manage sprints and technical resource planning
🧾 Consulting Firms – Monitor billable vs non-billable hours
Whether you run a small agile team or a global enterprise, this dashboard delivers clarity and control over your most valuable asset—your people.
✅ Click here to read the Detailed blog post
🔗 Visit our YouTube channel to learn step-by-step video tutorials


Reviews
There are no reviews yet.