

Faith-based organizations are evolving — adopting digital tools to strengthen transparency, accountability, and community engagement. From managing donations and tracking events to evaluating member satisfaction, data now plays a vital role in supporting the mission and impact of religious institutions.
That’s where the Religious & Faith-Based Organizations Dashboard in Power BI comes in — a powerful, ready-to-use business intelligence tool designed to help churches, mosques, temples, ministries, and other faith-based groups monitor their activities, finances, and engagement metrics with ease. 🌍📊
Built entirely in Microsoft Power BI, this dashboard consolidates your organization’s data — from donations and events to expenses and satisfaction scores — into one visual, interactive platform. It empowers leaders to make data-driven decisions that align with their mission, while ensuring transparency and stewardship at every level.
🌟 Key Features of the Religious & Faith-Based Organizations Dashboard in Power BI
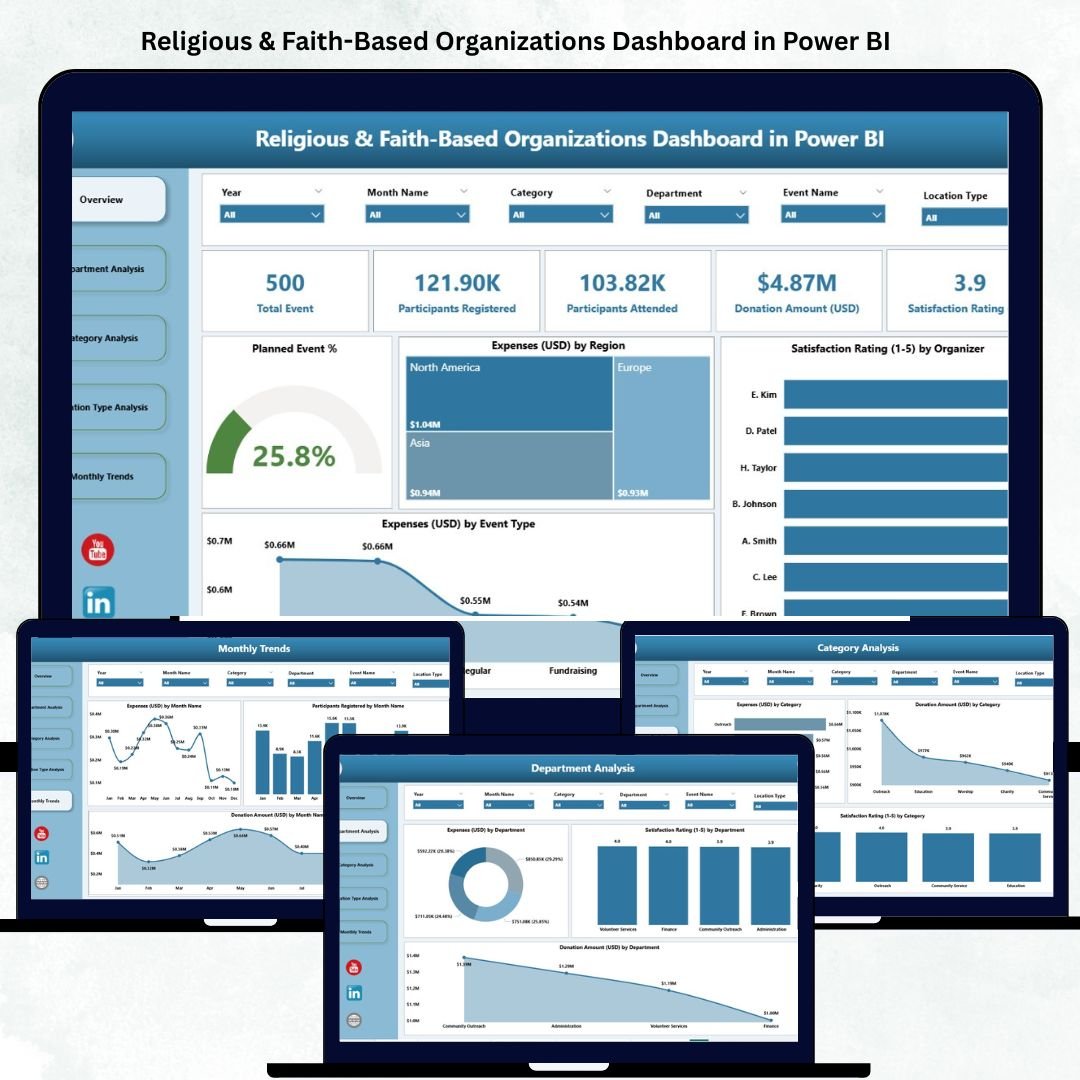
⛪ Overview Page – The Central Hub of Insights
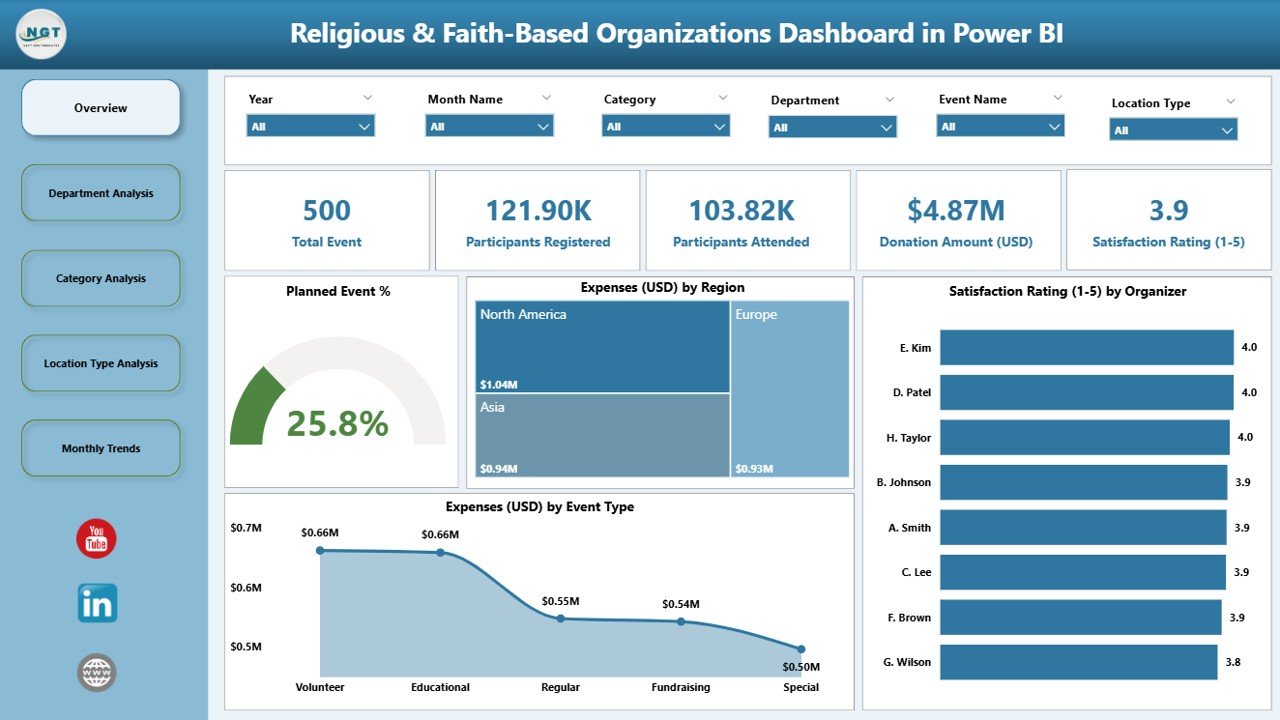
View your organization’s overall health at a glance.
KPI Cards: Show metrics such as Planned Event %, Total Donations, Total Expenses, and Average Satisfaction Rating.
Interactive Charts:
Planned Event % – Monitor event completion and adherence.
Expenses (USD) by Region – Compare spending across locations.
Satisfaction Rating (1–5) by Organizer – Assess event quality and participant happiness.
Expenses (USD) by Event Type – Analyze cost distribution across categories such as community outreach, prayer sessions, or charity drives.
This page provides faith leaders a clear understanding of financial and engagement performance.
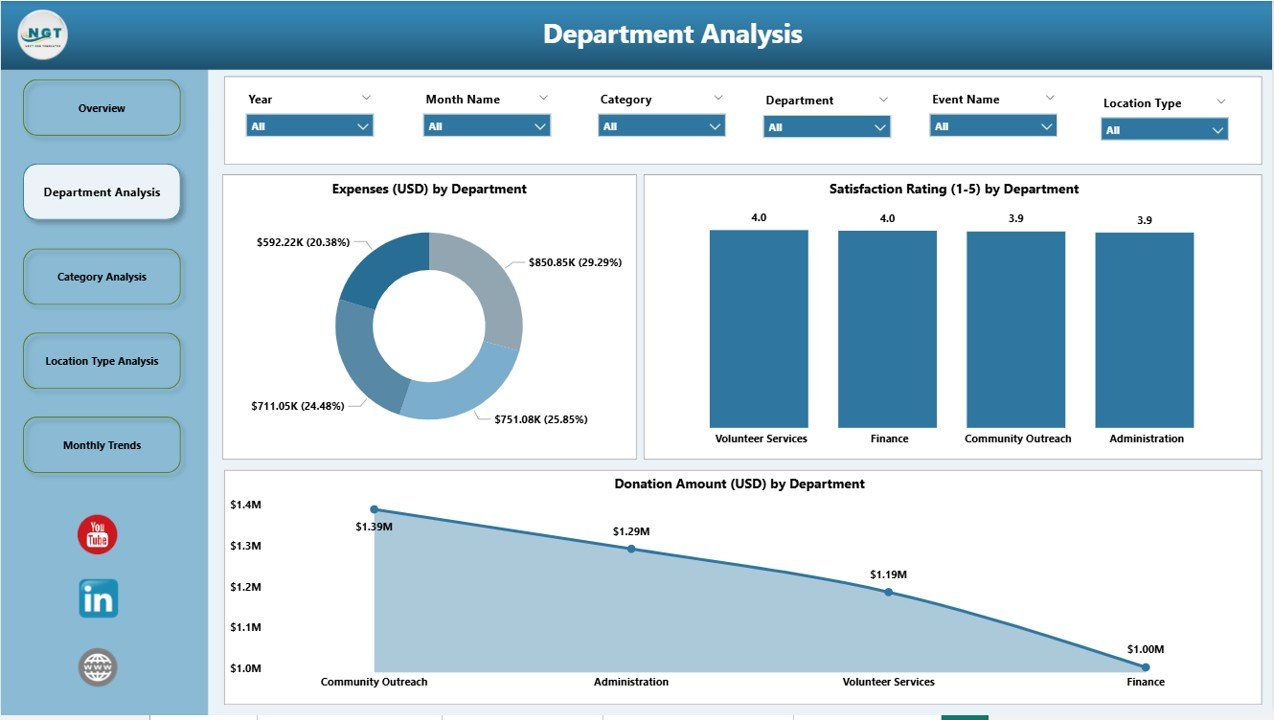
🕊️ Department Analysis Page
Evaluate how each department contributes to your mission and financial success.
Event (USD) by Department
Satisfaction Rating (1–5) by Department
Donation Amount (USD) by Department
Gain clarity on which ministries (e.g., youth, outreach, finance, administration) are thriving and which need more attention or support.
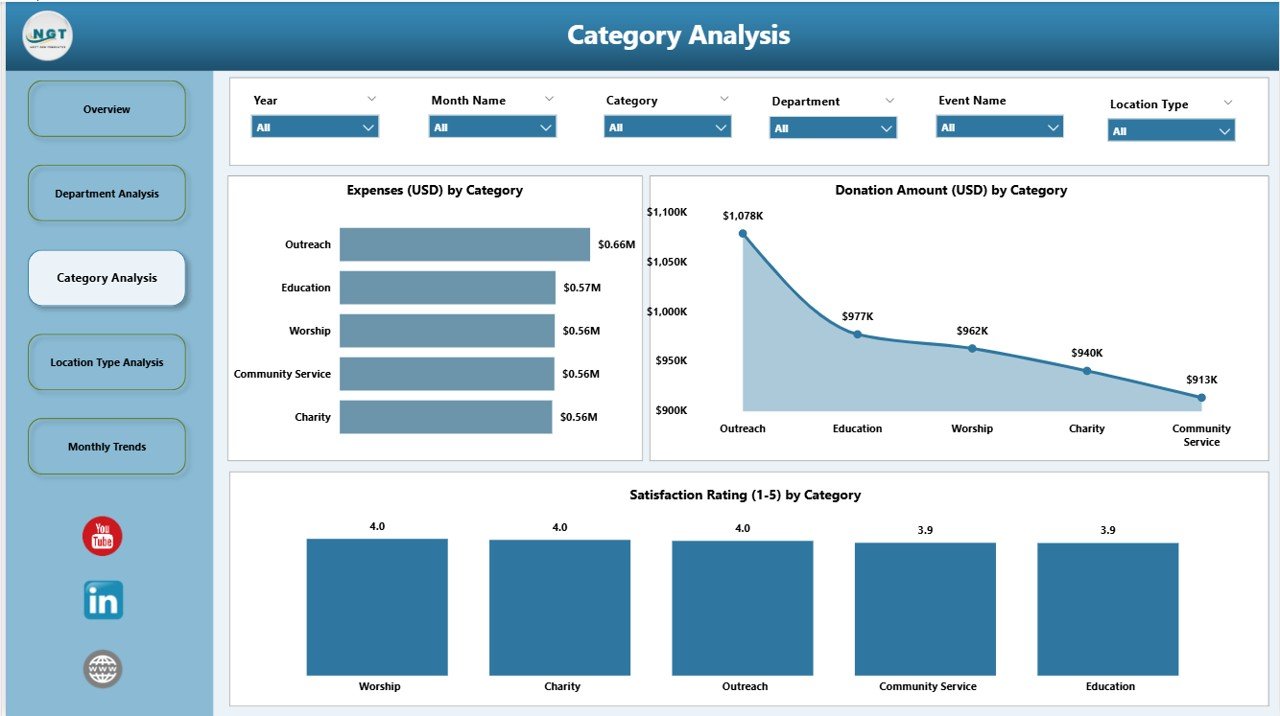
📂 Category Analysis Page
Understand program effectiveness by type — fundraising, volunteer initiatives, education, or worship.
Event (USD) by Category
Satisfaction Rating (1–5) by Category
Donation Amount (USD) by Category
This page helps identify which activities have the highest engagement, impact, and donation potential.
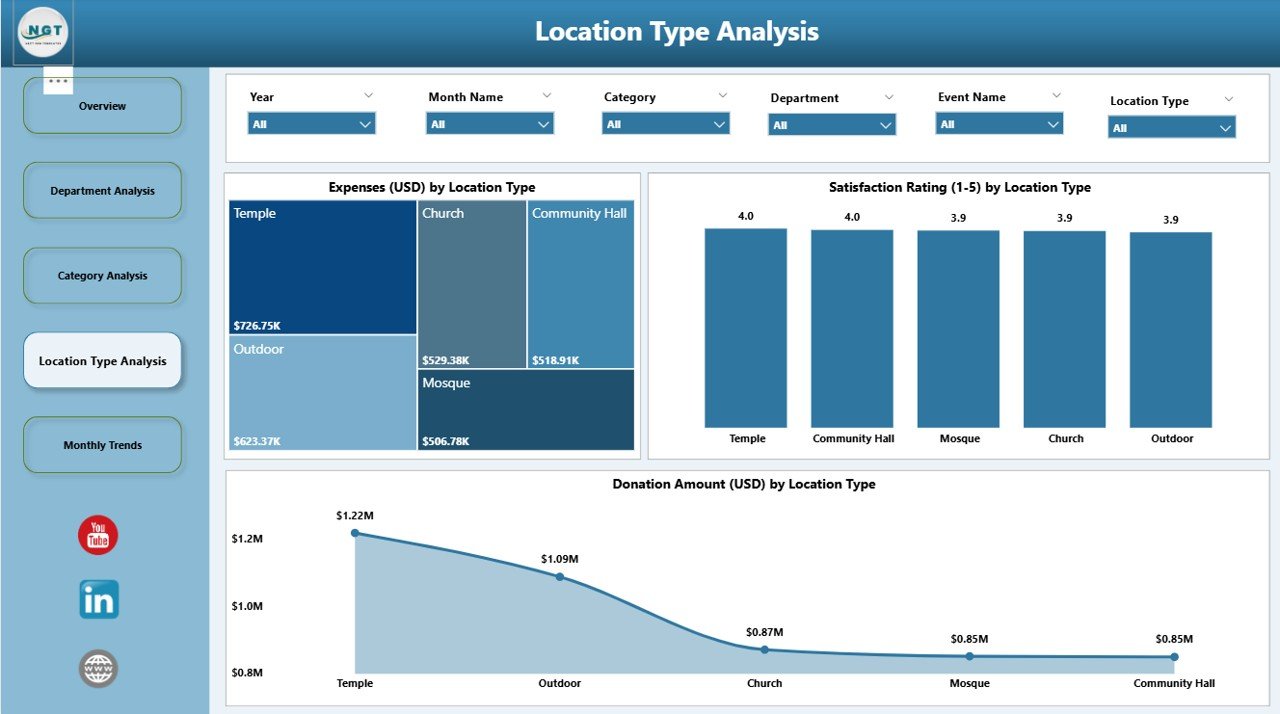
📍 Location Type Analysis Page
Track performance across different locations or branches.
Event (USD) by Location Type
Satisfaction Rating (1–5) by Location Type
Donation Amount (USD) by Location Type
Ideal for multi-branch ministries, regional churches, or global missions looking to understand geographic performance patterns.
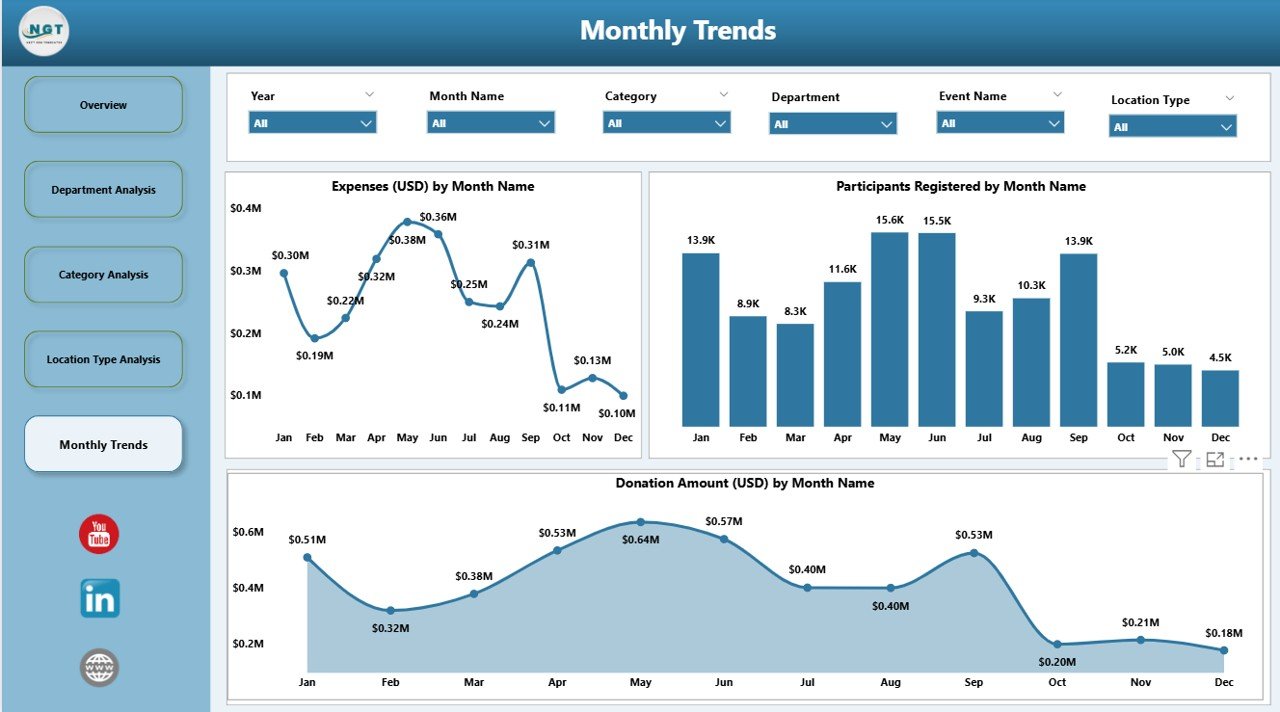
📆 Monthly Trends Page
Analyze progress and patterns over time.
Event (USD) by Month
Donation Amount (USD) by Month
Participants Registered by Month
Identify peak seasons for events and donations, helping you plan campaigns and community activities strategically.
📦 What’s Inside the Dashboard
✅ 5 Interactive Pages: Overview, Department, Category, Location Type, and Monthly Trends
✅ Dynamic Slicers: Filter by region, month, or department for tailored insights
✅ Auto-Updating KPIs: See real-time results with each data refresh
✅ Drill-Down Analysis: Click to explore details by location, event, or department
✅ Professional Visual Design: Built for clarity, accountability, and impact
🧭 How to Use the Dashboard
1️⃣ Connect Your Data: Import from Excel, Google Sheets, or donor management systems.
2️⃣ Refresh Automatically: Keep reports up to date with Power BI’s auto-refresh.
3️⃣ Explore with Filters: Use slicers to analyze by event, category, or location.
4️⃣ Drill Down into Details: View performance by department or monthly trend.
5️⃣ Share Securely: Publish to Power BI Service for team and board access.
No technical experience required — just open, refresh, and start analyzing! ⚡
👥 Who Can Benefit
🛕 Church or Temple Administrators: Monitor donations, expenses, and attendance.
🤝 Community Outreach Teams: Track participation and engagement.
💰 Finance Departments: Ensure transparency and accountability in fund usage.
🎯 Event Coordinators: Analyze performance and satisfaction after programs.
📈 Leadership Boards: Evaluate ministry growth and make informed strategic decisions.
This dashboard brings faith and data together — making operations more effective, transparent, and aligned with purpose.
🌍 Why Choose This Power BI Dashboard
✔️ Centralized Data Management: Combine donations, expenses, and event metrics in one place.
✔️ Financial Transparency: Show donors and stakeholders where funds are used.
✔️ Better Decision-Making: Identify trends, strengths, and improvement areas.
✔️ Enhanced Engagement: Track satisfaction and participation across programs.
✔️ Customizable Design: Add KPIs, adjust visuals, and match your organization’s branding.
✔️ Scalable Solution: Perfect for small ministries or large multi-location organizations.
The Religious & Faith-Based Organizations Dashboard in Power BI empowers communities to lead with data, ensuring every event, dollar, and volunteer hour supports the greater mission. 🙌
### Click here to read the Detailed blog post
Visit our YouTube channel to learn step-by-step video tutorials








Reviews
There are no reviews yet.