
Humanitarian work runs on urgency, responsibility, and accountability.
Your team manages food distribution, healthcare services, shelter programs, education initiatives, and employment support — all while working with limited budgets and strict donor reporting requirements.
But here’s the challenge:
Are you clearly measuring impact?
Are you tracking monthly progress accurately?
Are you confidently presenting structured reports to donors?
If you’re still juggling scattered spreadsheets, you’re losing clarity.
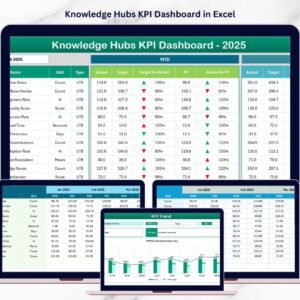
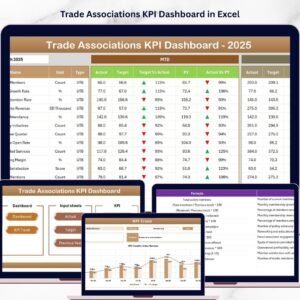
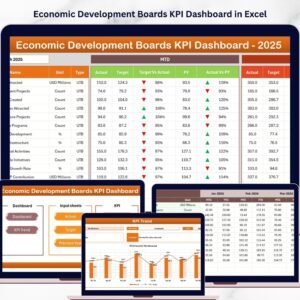
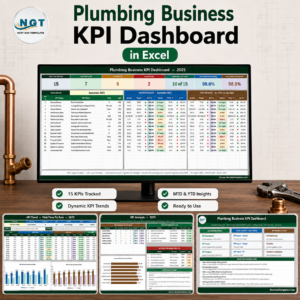
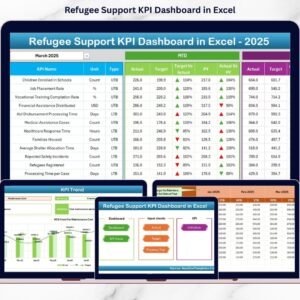
The Refugee Support KPI Dashboard in Excel is a ready-to-use, structured performance tracking system designed specifically for NGOs, humanitarian organizations, and relief agencies.
It centralizes your data, compares targets with actual results, tracks previous year performance, and highlights trends — all in one powerful Excel file.
This isn’t just reporting.
This is impact measurement made simple. 📊🌍
🚀 Key Feature of Refugee Support KPI Dashboard in Excel
📊 Dynamic Monthly Dashboard (MTD & YTD)
Select the month in cell D3 — the entire dashboard updates instantly.
🎯 Target vs Actual Comparison
Identify performance gaps using automatic percentage calculations and visual arrows.
📈 Previous Year Comparison
Measure growth, improvement, or decline with year-over-year analysis.
📉 Conditional Formatting Indicators
Up and down arrows highlight positive and negative trends immediately.
📂 7 Structured Worksheets
Clear separation of Dashboard, Input Sheets, Trend Analysis, and KPI Definitions.
🧭 Home Navigation Page
Quick navigation buttons help users move smoothly between sheets.
📑 KPI Trend Sheet with Charts
Visual MTD and YTD trend charts for each KPI.
🛠 Separate Actual, Target & Previous Year Sheets
Ensures clean data flow and minimizes reporting errors.
📋 Fully Customizable KPI Structure
Add new KPIs, groups, and units easily.
📦 What’s Inside the Refugee Support KPI Dashboard in Excel
This dashboard includes 7 professionally structured worksheets:
1️⃣ Home Sheet

Navigation buttons
Clean layout
Quick access to all sheets
2️⃣ Dashboard Sheet
MTD Actual, Target & Previous Year
YTD Actual, Target & Previous Year
Target vs Actual %
Previous Year vs Actual %
Conditional formatting arrows
3️⃣ KPI Trend Sheet
Select KPI from drop-down (Cell C3)
Displays KPI Group, Unit, Type, Formula & Definition
MTD Trend Chart
YTD Trend Chart
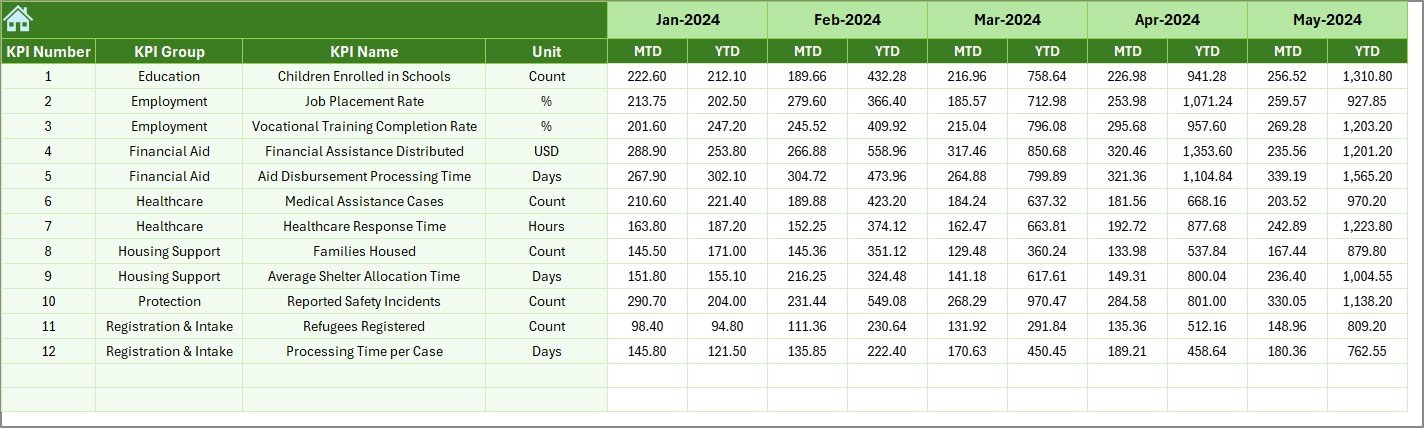
4️⃣ Actual Numbers Input Sheet
Enter monthly actual data
Change first month in cell E1
Input MTD & YTD values
5️⃣ Target Sheet
Enter monthly target numbers
Drives performance comparison
6️⃣ Previous Year Numbers Sheet
Stores historical data
Enables growth and impact tracking
7️⃣ KPI Definition Sheet
KPI Name
KPI Group
Unit
Formula
KPI Definition
This structured design ensures accuracy, transparency, and scalability.
🛠 How to Use the Refugee Support KPI Dashboard in Excel
Using the dashboard is simple:
1️⃣ Define your KPIs in the KPI Definition sheet
2️⃣ Enter Target numbers monthly
3️⃣ Input Actual numbers in the Actual sheet
4️⃣ Add Previous Year data
5️⃣ Select month in Dashboard (Cell D3)
6️⃣ Review MTD & YTD performance
7️⃣ Analyze KPI trends
8️⃣ Present results to donors confidently
No advanced Excel skills required — just structured data entry.
👥 Who Can Benefit from This Refugee Support KPI Dashboard in Excel
This dashboard is ideal for:
🌍 Humanitarian Organizations
🤝 NGOs & Relief Agencies
🏥 Healthcare Support Programs
🏠 Shelter & Housing Projects
📚 Education Support Programs
🍲 Food Distribution Programs
💼 Employment & Skill Development Initiatives
Whether you manage a small local NGO or an international relief agency, this dashboard improves transparency and control.
Why This Dashboard Is Essential for Humanitarian Impact
With this dashboard, you can clearly track:
👥 Beneficiaries Served
🍲 Meals Distributed
🏠 Shelters Provided
🏥 Medical Consultations
📚 School Enrollments
💼 Job Placements
💰 Cost per Beneficiary
Instead of assumptions, you use measurable performance indicators.
You detect underperforming programs early.
You align activities with donor goals.
You improve resource allocation.
You strengthen accountability.
Most importantly — you prove impact.
How It Improves Decision Making
Because you see:
Monthly performance (MTD)
Year-to-date progress (YTD)
Previous year comparisons
Growth trends
Leadership can:
✔ Allocate funds strategically
✔ Adjust program priorities
✔ Improve operational efficiency
✔ Increase donor confidence
✔ Strengthen reporting transparency
Clear data leads to stronger impact.
Click here to read the Detailed blog post
Visit our YouTube channel to learn step-by-step video tutorials
YouTube Channel