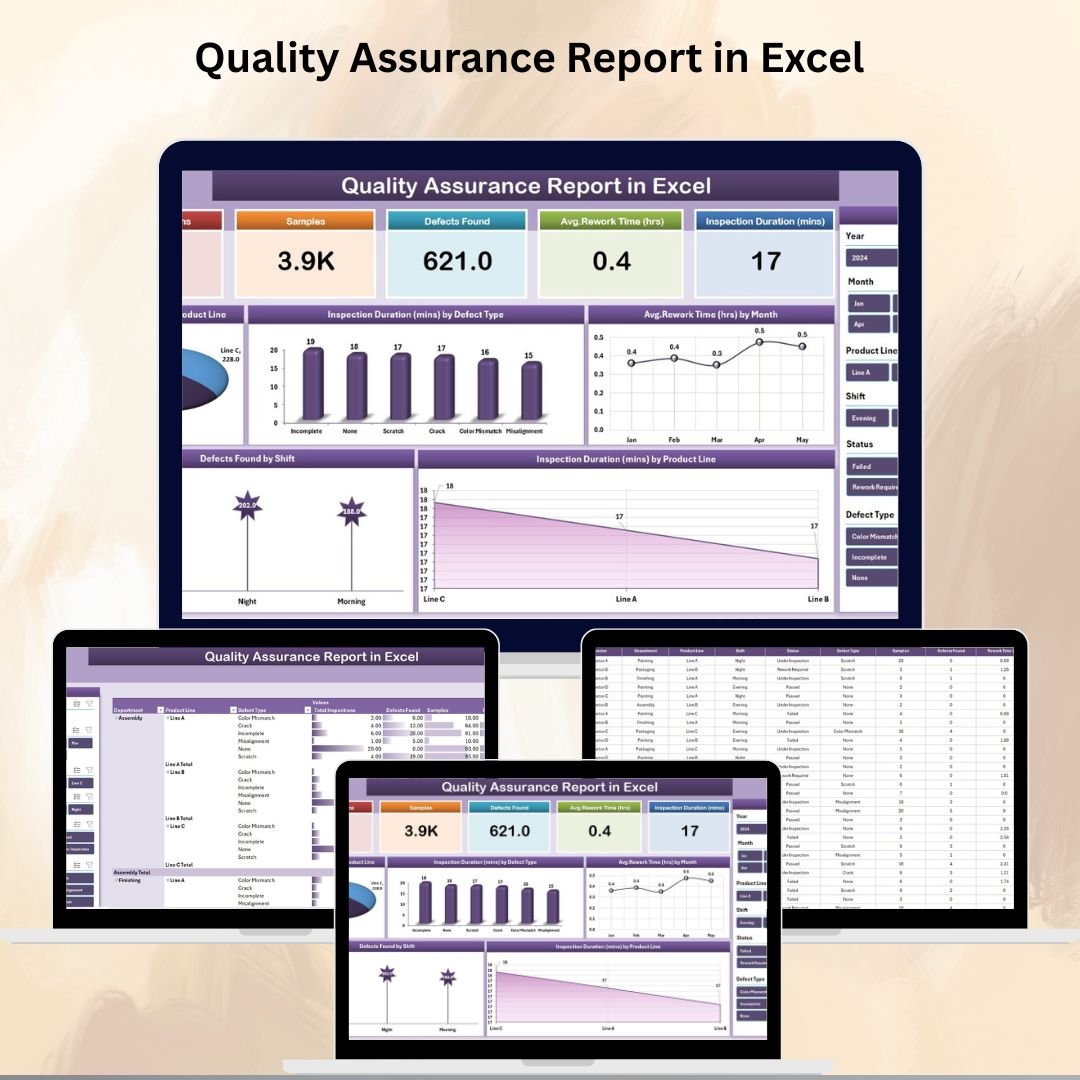

Quality assurance (QA) is the backbone of consistent product quality, customer satisfaction, and regulatory compliance. But when inspection data, defect logs, and rework reports are scattered across multiple files, QA teams lose valuable time and risk overlooking critical issues. That’s why a Quality Assurance Report in Excel is a must-have tool for any organization that values efficiency and accuracy.
This ready-to-use Excel template centralizes all quality-related data into one structured, interactive system. With dynamic charts, slicers, and KPI cards, it helps managers, supervisors, and QA teams quickly analyze performance trends, track defects, and monitor inspection times. Instead of spending hours compiling data, you’ll have real-time insights at your fingertips.
✨ Key Features of the Quality Assurance Report in Excel
-
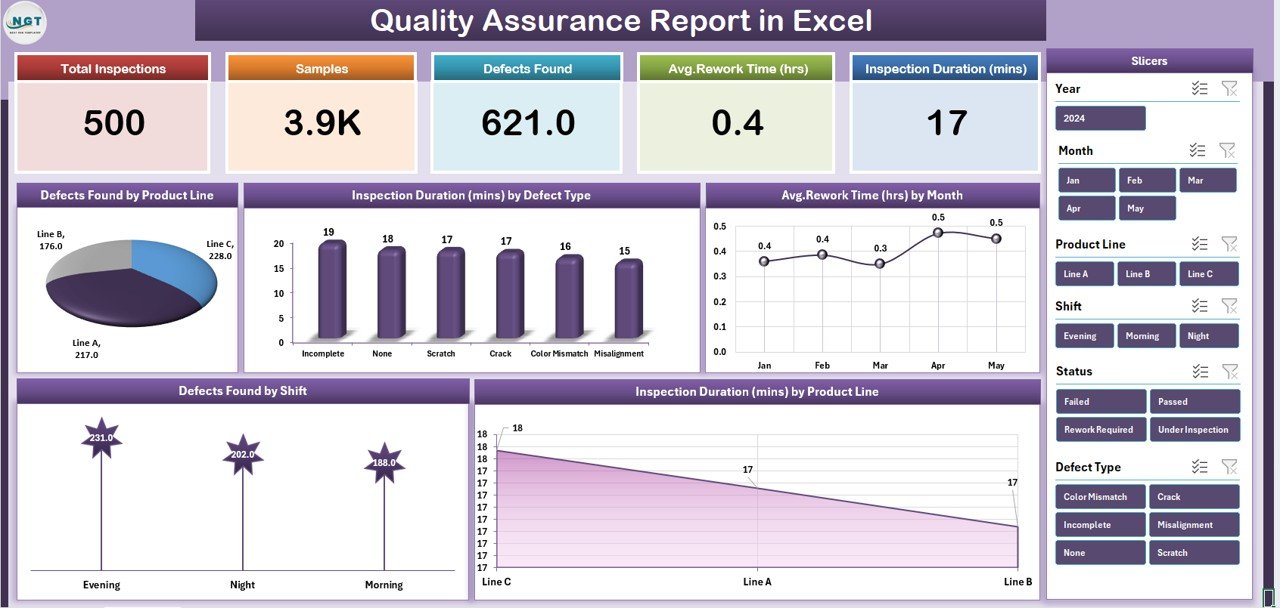
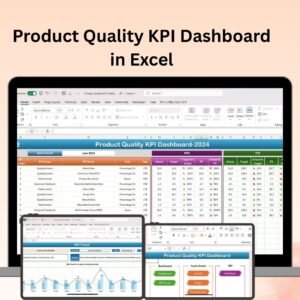
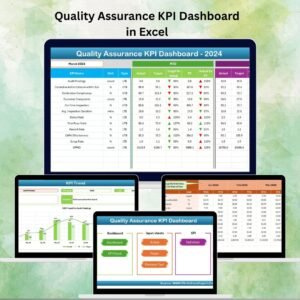
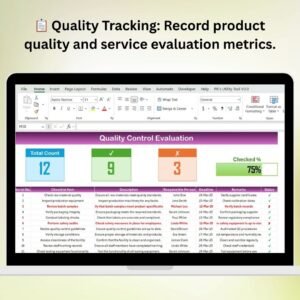
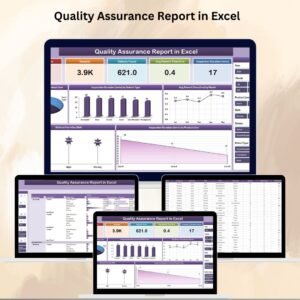
📊 Summary Page Dashboard – Displays KPI cards for critical quality metrics, along with five dynamic charts showing defects, inspection duration, and rework hours.
-
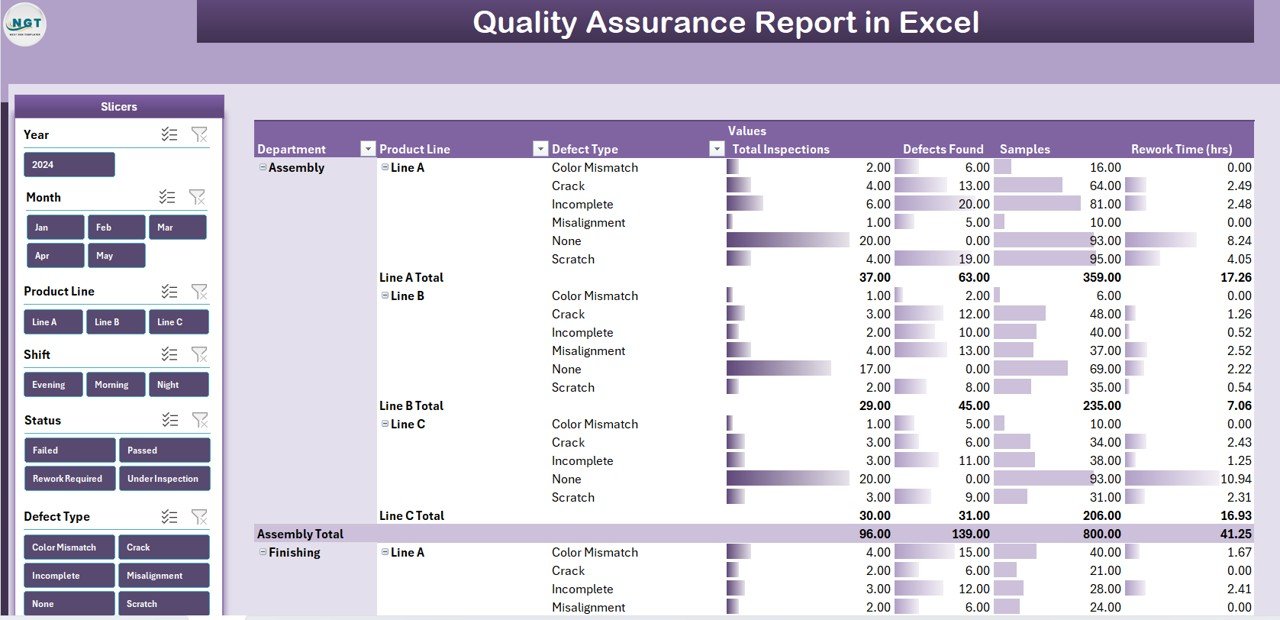
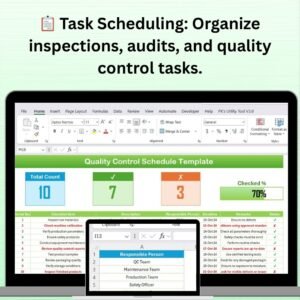
📑 Report Page – Provides a detailed view with slicers and data tables for customized reporting and audit preparation.
-
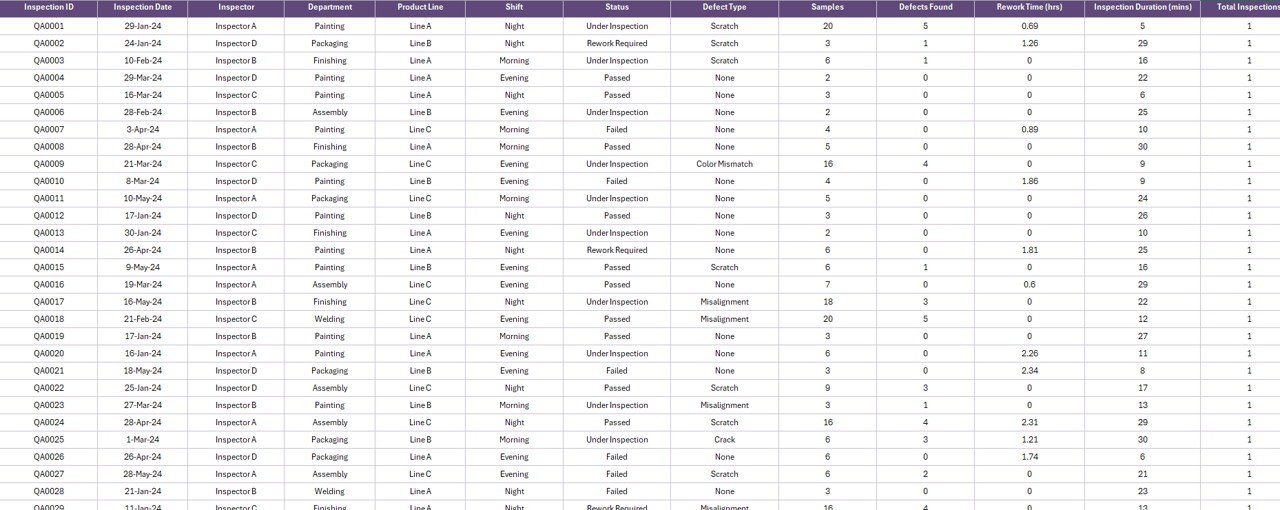
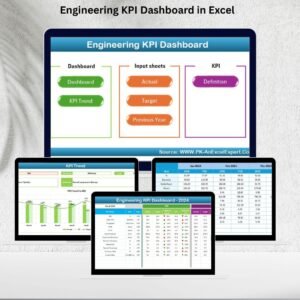
📂 Data Sheet – Stores raw QA data such as defect types, inspection durations, product lines, and rework time in a clean, structured format.
-
🔧 Support Sheet – Contains reference lists for defect categories, product lines, and shifts, ensuring data entry remains standardized.
-
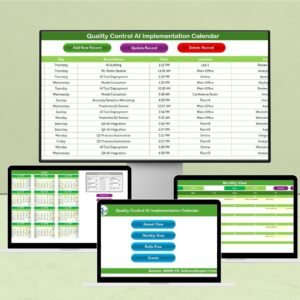
🎛️ Interactive Slicers – Filter results instantly by date, shift, defect type, or product line for targeted insights.
-
📈 Automated Calculations – Built-in formulas compute defect percentages, averages, and variances to minimize manual work.
📊 What’s Inside the QA Report Template
-
Five KPI Cards – Instantly track defect rates, first pass yield, rework hours, inspection time, and defects by product line.
-
Dynamic Charts – Visualize trends such as defects by shift, inspection duration by product line, and rework time by month.
-
Data-Driven Reports – Refresh pivot tables to update all visuals with the latest data.
-
Audit-Friendly Design – Generate summaries that are ready to share with auditors, managers, or regulatory bodies.
🛠️ How to Use the Quality Assurance Report
1️⃣ Enter Raw Data – Log inspection results, defect types, shifts, and rework times in the Data Sheet.
2️⃣ Standardize Inputs – Use the Support Sheet for consistent categories and values.
3️⃣ Refresh Pivot Tables – Update calculations and charts with a single click.
4️⃣ View Summary Page – Get high-level KPIs and visual insights instantly.
5️⃣ Drill Down – Use slicers to analyze by product line, shift, or defect type.
6️⃣ Generate Reports – Export charts or share the Report Page for audits and management reviews.
👥 Who Can Benefit from This Template?
-
🏭 Manufacturing Plants – Track defects by production line or shift.
-
🏢 Corporate QA Teams – Monitor quality across multiple departments.
-
📦 Logistics & Warehousing – Ensure product inspection standards are met.
-
🏫 Educational Institutions – Manage QA processes in labs or training centers.
-
🏥 Healthcare & Pharma – Track quality inspections for compliance and safety.
💡 Advantages of the Quality Assurance Report in Excel
-
⚡ Real-Time Insights – Use slicers and charts to identify issues instantly.
-
⏳ Time Savings – Automated metrics reduce manual reporting hours.
-
✅ Improved Accuracy – Standardized lists prevent inconsistent entries.
-
📈 Performance Monitoring – Track inspection trends, defect rates, and rework.
-
📋 Audit-Ready – Keep structured, easy-to-share reports for compliance.
-
💰 Cost-Effective – No need for expensive QA software; Excel does the job.
🚀 Opportunities for Improvement
-
🔄 Automation – Add Power Query or macros to reduce manual data entry.
-
📊 Advanced Visualization – Use conditional formatting for threshold alerts.
-
🔗 Integration – Connect with ERP or database systems for real-time updates.
-
☁️ Collaboration – Share via Excel Online or SharePoint for team access.
✅ Best Practices for QA Reporting
-
Use structured data tables to ensure clean analysis.
-
Apply slicers and filters for interactive reporting.
-
Highlight critical defect rates with conditional formatting.
-
Update the report regularly to keep insights relevant.
-
Protect sensitive data with Excel password features.
Click here to read the Detailed blog post
Visit our YouTube channel to learn step-by-step video tutorials
👉 PKAnExcelExpert


Reviews
There are no reviews yet.