
The Property Management KPI Dashboard in Excel is a comprehensive tool designed for property managers, real estate professionals, and business owners to track and analyze key performance indicators (KPIs) across various aspects of property management. This Excel-based dashboard helps you monitor property performance, tenant satisfaction, financial metrics, and maintenance activities, enabling you to make data-driven decisions and optimize your property management strategies.
With real-time tracking, customizable visuals, and an easy-to-use interface, this dashboard helps you manage your properties effectively, enhance tenant satisfaction, and improve profitability.

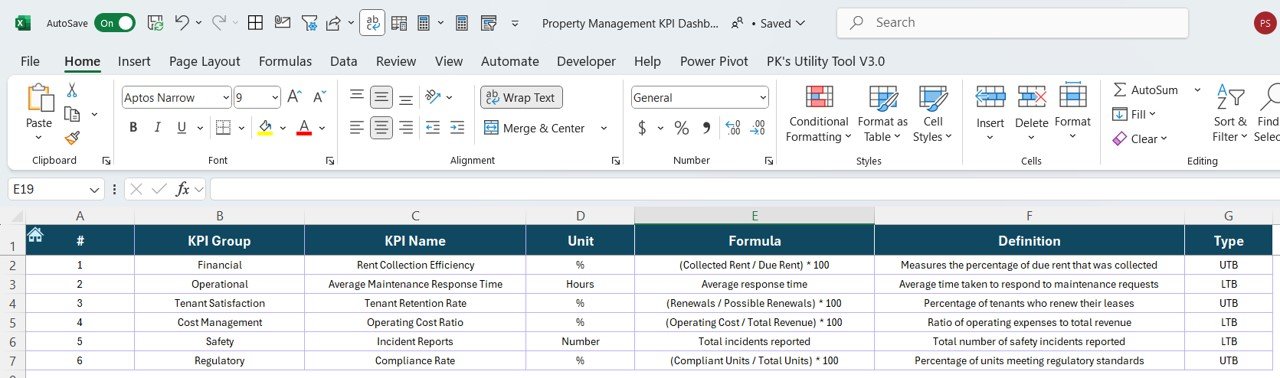
Key Features of the Property Management KPI Dashboard in Excel:
🏢 Property Performance Tracking
Monitor key metrics related to property performance, including occupancy rates, rental income, and property value, ensuring your properties are maximizing their potential.
💰 Financial Metrics and Rent Collection
Track income from rent payments, expenses, and profitability, ensuring that your properties are generating positive cash flow and meeting financial goals.
🔧 Maintenance and Repairs Monitoring
Track maintenance requests, repairs, and service calls, ensuring timely response and resolution to keep tenants satisfied and reduce downtime.
📊 Tenant Satisfaction and Retention
Monitor tenant satisfaction by tracking feedback, lease renewals, and retention rates, helping you improve tenant relationships and reduce vacancies.
📅 Lease and Renewal Management
Track lease start and end dates, renewal deadlines, and lease terms to ensure that you don’t miss any key deadlines and maintain tenant occupancy.
🚀 Why You’ll Love the Property Management KPI Dashboard in Excel:
✅ Maximize Property Performance – Track key metrics such as occupancy rates, rental income, and property value to ensure your properties are performing at their best.
✅ Enhance Financial Control – Monitor rent collection, expenses, and overall financial health to ensure positive cash flow and profitability.
✅ Optimize Tenant Satisfaction – Track tenant feedback, retention, and lease renewals to enhance tenant relationships and reduce vacancy rates.
✅ Improve Operational Efficiency – Monitor and track maintenance requests, repairs, and service calls to ensure timely responses and efficient property management.
✅ Customizable and User-Friendly – Fully customizable to fit your specific property management needs, with easy-to-use features and intuitive navigation.
✅ Data-Driven Decision Making – Use real-time data and visualizations to make informed decisions and improve the performance of your property portfolio.
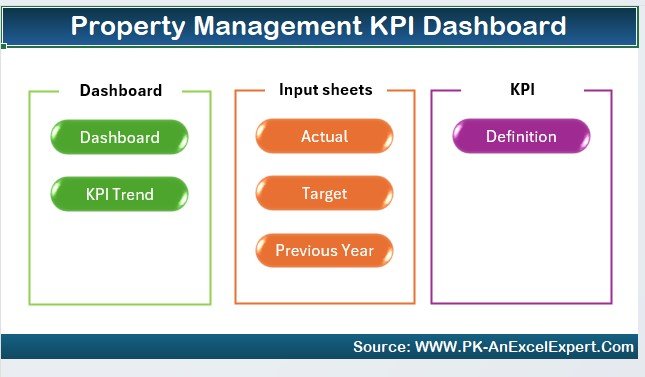
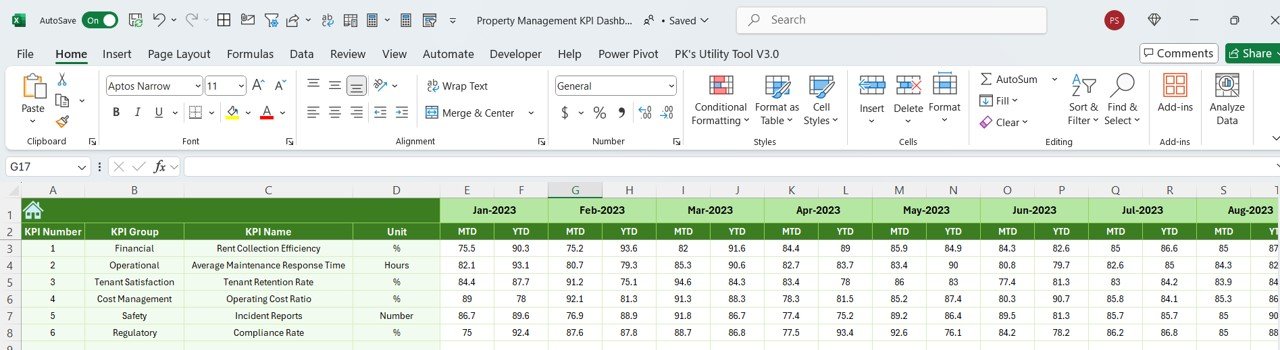
What’s Inside the Property Management KPI Dashboard in Excel:
-
Property Performance: Track occupancy rates, rental income, and property value to ensure maximum profitability and performance.
-
Financial Monitoring: Track rent payments, expenses, and profit margins to ensure financial stability and growth.
-
Maintenance and Service Tracking: Track maintenance requests and repairs, ensuring quick and efficient resolution of issues.
-
Tenant Satisfaction: Monitor tenant satisfaction, feedback, and renewal rates to improve tenant relationships and reduce vacancies.
-
Lease Management: Track lease terms, renewal deadlines, and tenant agreements to maintain long-term occupancy and streamline property management tasks.
-
Custom Reports: Generate tailored reports to analyze property performance, financial data, and maintenance activities, helping you make informed management decisions.
How to Use the Property Management KPI Dashboard in Excel:
1️⃣ Download the Template – Instantly access your Excel file upon purchase.
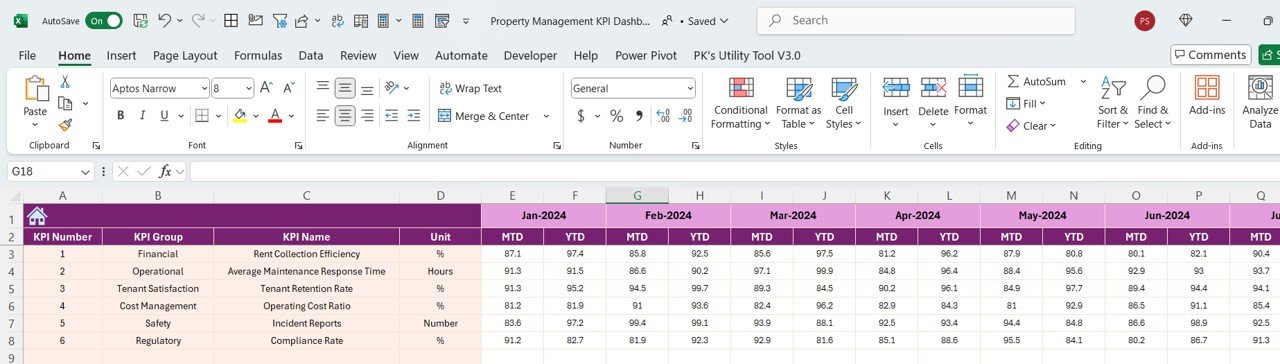
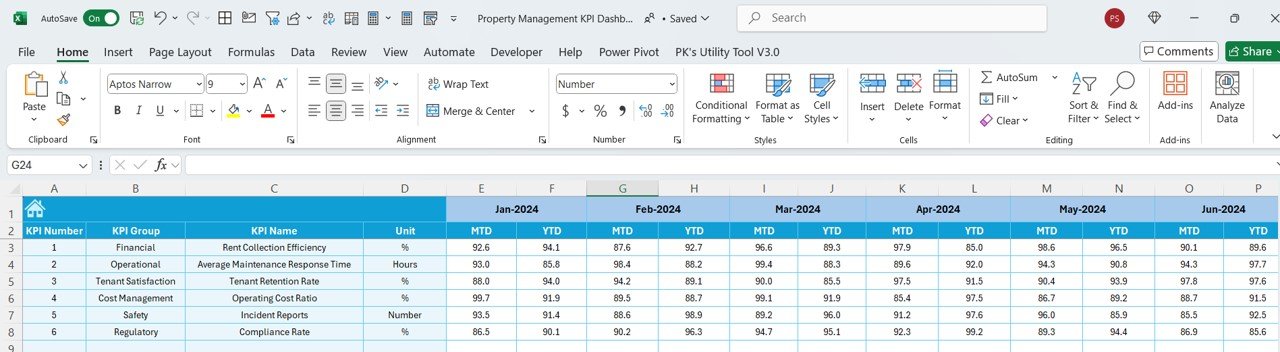
2️⃣ Enter Property and Financial Data – Add your property details, tenant information, rental income, and expenses to begin tracking performance metrics.
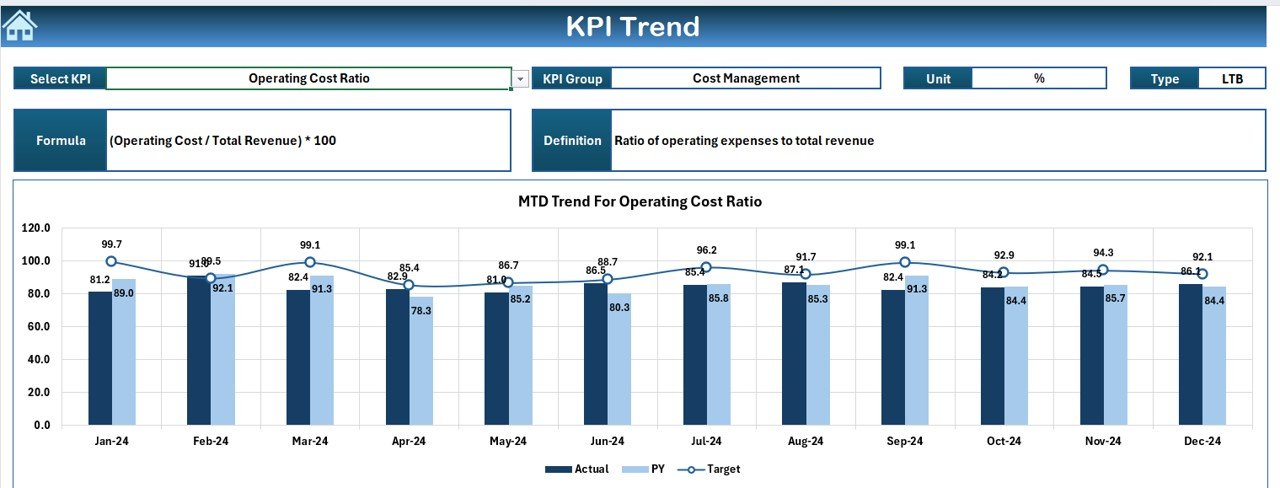
3️⃣ Monitor Property and Financial KPIs – Use the dashboard to monitor occupancy rates, rental income, maintenance requests, and tenant satisfaction in real-time.
4️⃣ Track Maintenance and Repairs – Track maintenance tasks and repairs, ensuring that issues are resolved promptly and tenant satisfaction remains high.
5️⃣ Generate Reports – Create detailed reports summarizing key metrics, allowing you to analyze performance and identify opportunities for improvement.
Who Can Benefit from the Property Management KPI Dashboard in Excel:
-
Property Managers
-
Real Estate Investors
-
Landlords
-
Property Management Teams
-
Facility Managers
-
Small and Medium-Sized Property Owners
-
Large Property Management Firms
-
Commercial Property Managers
The Property Management KPI Dashboard in Excel is the ultimate tool for property managers looking to streamline their operations, track financial and operational performance, and improve tenant satisfaction. Whether you manage a single property or an entire portfolio, this dashboard provides the insights you need to optimize property management and maximize profitability.
Click here to read the Detailed blog post
https://www.pk-anexcelexpert.com/property-management-kpi-dashboard-in-excel/
Visit our YouTube channel to learn step-by-step video tutorials
Youtube.com/@PKAnExcelExpert


Reviews
There are no reviews yet.