
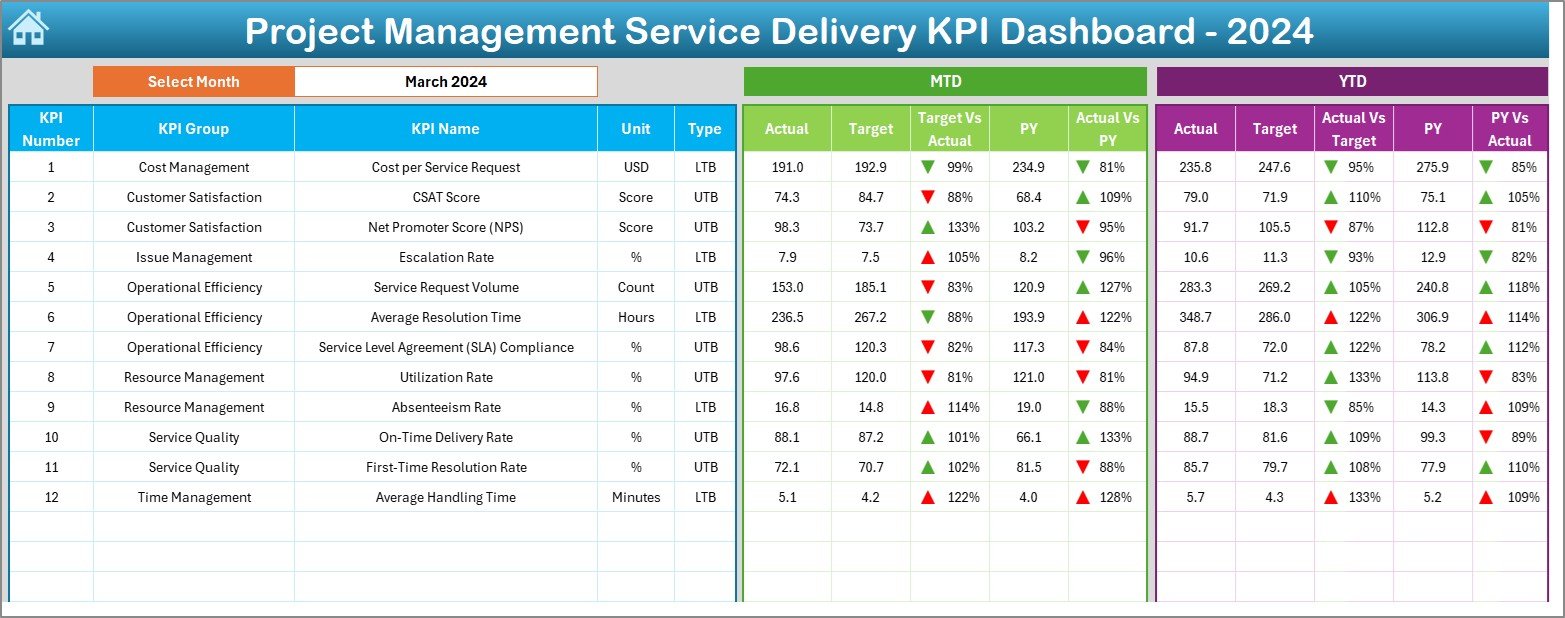


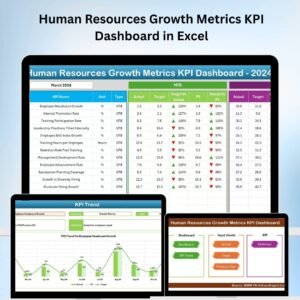
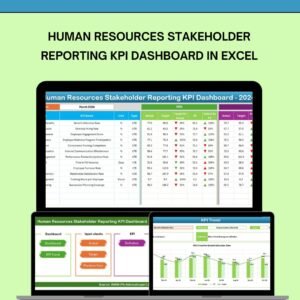
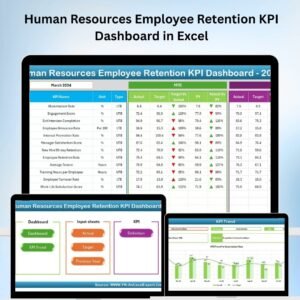
The Project Management Service Delivery KPI Dashboard in Excel is a powerful tool designed to help project managers, team leads, and business owners track and optimize the performance of their service delivery processes. This Excel-based dashboard enables you to monitor key performance indicators (KPIs) such as project completion rates, task timelines, and resource utilization, offering a comprehensive overview of your project’s health.
By centralizing all important metrics in one place, this dashboard ensures that you can quickly identify bottlenecks, measure progress against targets, and make data-driven decisions. Whether you’re managing multiple projects or overseeing a single initiative, this tool will help you streamline project delivery, improve operational efficiency, and achieve consistent success.
Key Features of the Project Management Service Delivery KPI Dashboard in Excel
📊 Comprehensive KPI Tracking
Monitor key KPIs related to project timelines, resource utilization, task completion rates, and project costs. With the ability to track both historical and current performance, you can identify areas for improvement and ensure that your projects stay on track.
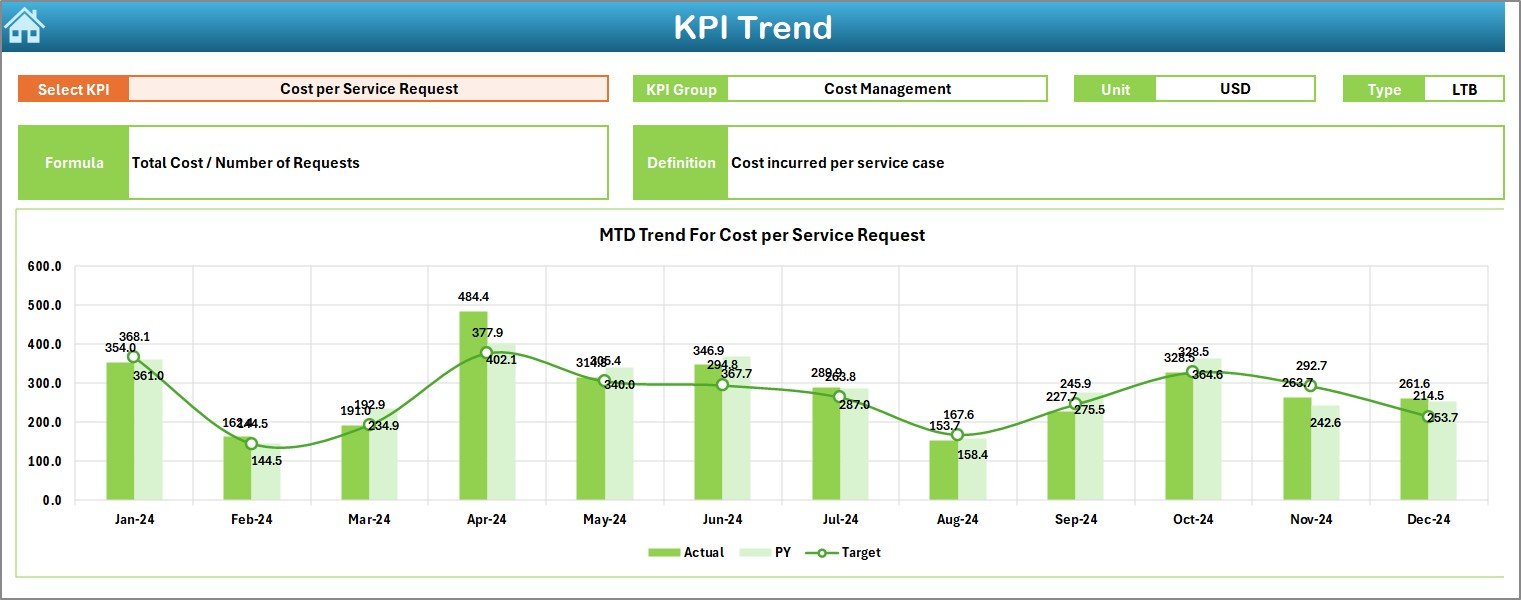
📈 Time-Based Tracking
Track both Month-to-Date (MTD) and Year-to-Date (YTD) data for all KPIs. This feature allows you to see progress over time and make informed decisions based on up-to-date data.
📅 Service Delivery Efficiency Monitoring
Keep tabs on the efficiency of your service delivery with clear indicators of completed vs pending tasks, resource allocation, and overall project performance.
⚙️ Customizable Input Fields
Easily input your project data, track task assignments, and update deadlines. The dashboard can be customized to reflect your specific project needs, ensuring that it works for any type of project, big or small.
🔄 Visual Data Analysis
The dashboard includes visual indicators such as progress bars, arrows, and color-coding to provide clear insights into project performance. This makes it easy to quickly identify areas that need attention.
Why You’ll Love the Project Management Service Delivery KPI Dashboard in Excel
✅ Efficient Project Monitoring
Keep all key project metrics in one place and monitor progress in real-time. This helps ensure that you’re meeting your project objectives and service delivery standards.
✅ Improved Decision Making
With access to a comprehensive view of your project data, you’ll be able to make informed decisions that drive project success and improve service delivery outcomes.
✅ Enhanced Visibility and Control
Gain full visibility into your service delivery process, from start to finish. The dashboard lets you track both high-level and detailed metrics, ensuring that nothing slips through the cracks.
✅ Customizable for Different Projects
Easily tailor the dashboard to fit the unique requirements of any project. Whether you’re managing internal initiatives or delivering services to clients, the flexibility of this tool makes it a perfect fit.
✅ Simplified Performance Analysis
Use the visual indicators to identify underperforming areas, measure resource utilization, and ensure that projects are on track to meet deadlines.
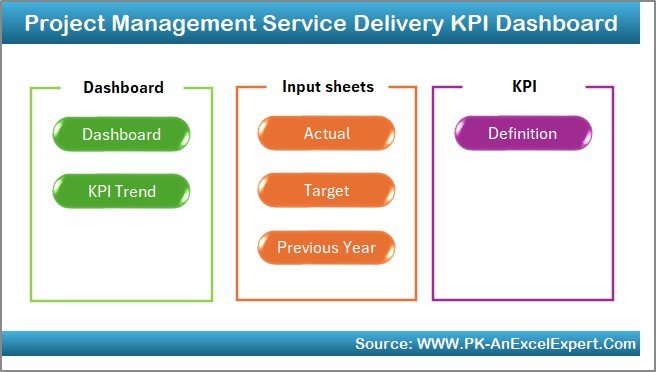
What’s Inside the Project Management Service Delivery KPI Dashboard in Excel?
-
KPI Tracking: Keep an eye on key performance indicators like task completion rates, project timelines, and resource utilization.
-
Time-Based Metrics: Track both Month-to-Date (MTD) and Year-to-Date (YTD) performance data.
-
Customizable Input Fields: Easily update project data such as task assignments, deadlines, and completion statuses.
-
Visual Indicators: Use progress bars, arrows, and color codes to easily visualize performance data.
-
Comprehensive Dashboard: A centralized view for tracking all aspects of project service delivery, from start to finish.
How to Use the Project Management Service Delivery KPI Dashboard in Excel
1️⃣ Download the Template: Access your Excel dashboard immediately after purchase.
2️⃣ Enter Your Project Data: Input task assignments, deadlines, and other relevant project data.
3️⃣ Track KPIs: Monitor key project metrics like completion rates and resource usage over time.
4️⃣ Analyze Performance: Use the dashboard’s visual indicators to assess how well your project is performing.
5️⃣ Make Data-Driven Decisions: Use insights from the dashboard to make adjustments, optimize resources, and improve project outcomes.
Who Can Benefit from the Project Management Service Delivery KPI Dashboard in Excel?
🔹 Project Managers
🔹 Team Leads
🔹 Business Owners
🔹 Service Delivery Managers
🔹 Operations Managers
🔹 PMO Teams
🔹 Consulting Firms
Ensure the success of your projects with the Project Management Service Delivery KPI Dashboard in Excel. Track, monitor, and improve your service delivery processes using key metrics and real-time data insights.
Click here to read the Detailed blog post
Visit our YouTube channel to learn step-by-step video tutorials
Youtube.com/@PKAnExcelExpert


Reviews
There are no reviews yet.