

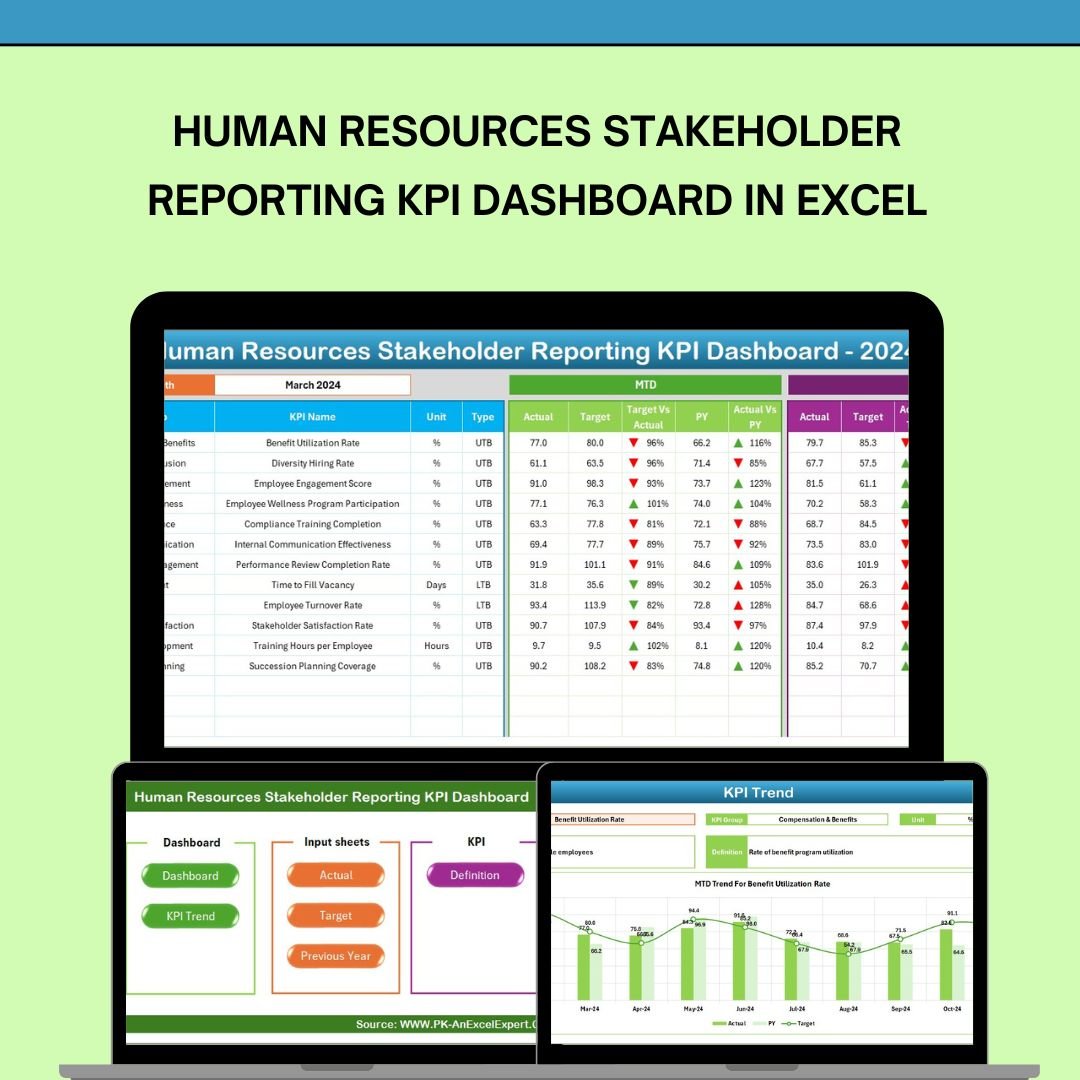

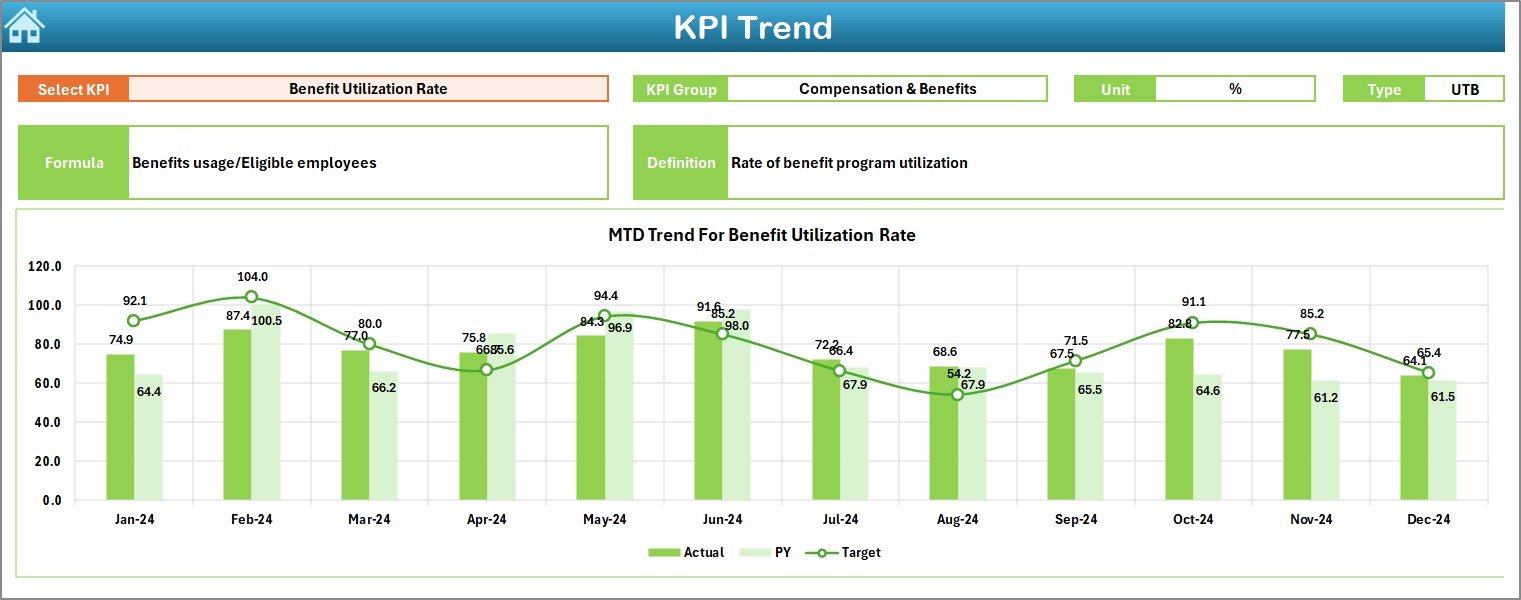

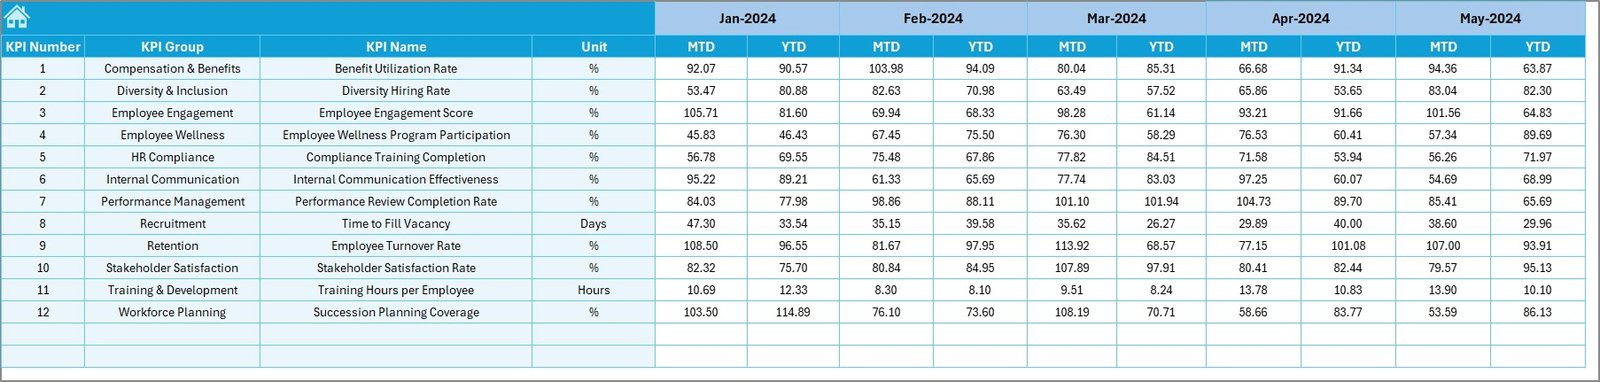
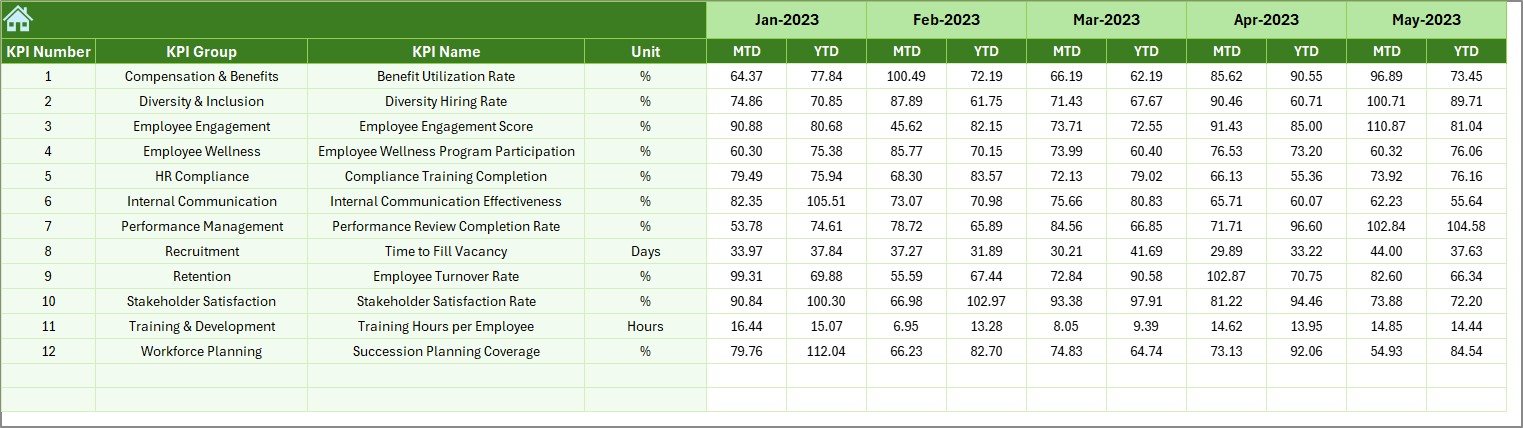
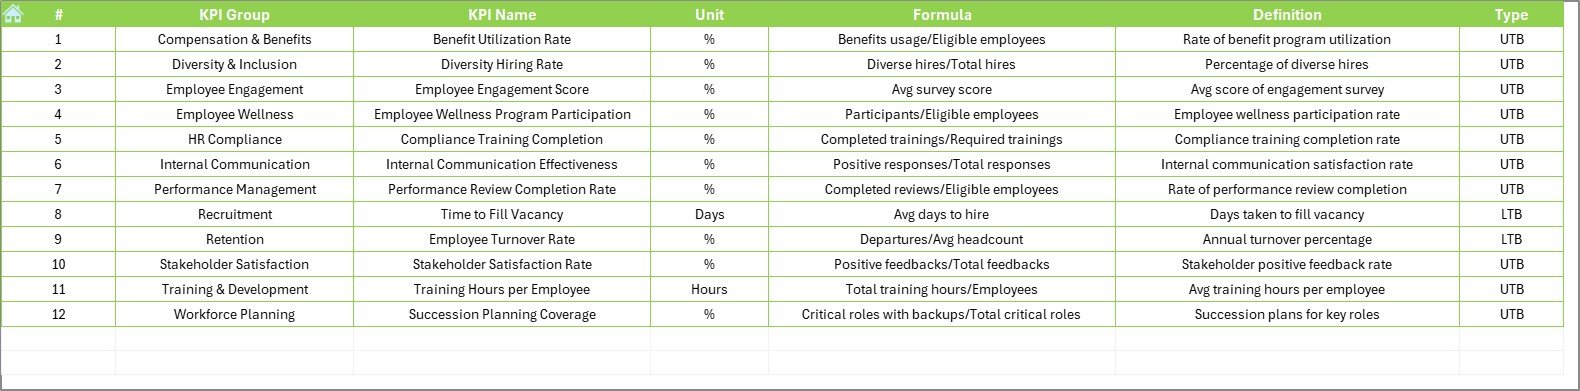

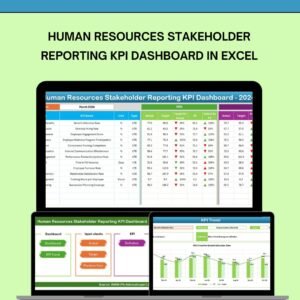
The Human Resources Stakeholder Reporting KPI Dashboard in Excel is a powerful tool designed to help HR departments and business leaders track, monitor, and report on key human resources metrics. This Excel-based dashboard provides an intuitive, easy-to-use interface that tracks essential KPIs such as employee retention, headcount, turnover rates, and employee performance, helping HR teams provide valuable insights to stakeholders in a clear and concise format.
This dashboard is essential for any HR department looking to streamline their reporting process and ensure that key stakeholders receive accurate and timely HR data. With its comprehensive features, the dashboard makes it easier to monitor HR performance, track employee engagement, and optimize workforce management.
Key Features of the Human Resources Stakeholder Reporting KPI Dashboard in Excel
📊 Comprehensive KPI Tracking
Track essential human resources KPIs such as headcount, turnover rates, employee retention, and employee satisfaction. Monitor these metrics in real time for better decision-making.
📉 Employee Retention & Turnover Analysis
Analyze employee retention and turnover data to assess the effectiveness of retention programs. Understand turnover trends and make informed decisions to improve employee engagement.
📈 Performance Metrics Monitoring
Track employee performance metrics such as productivity, goal completion, and performance reviews. Use this data to identify high performers and areas that require development.
📅 Time-Based Reporting
Generate reports based on specific time periods (monthly, quarterly, annually). This helps HR departments provide stakeholders with periodic insights into workforce performance and changes over time.
🔑 Customizable & Scalable Dashboard
Tailor the dashboard to suit your company’s specific HR metrics. Whether you’re tracking recruitment, compensation, or employee development, this tool can be customized to reflect your unique HR objectives.
⚙️ Real-Time Data Integration
Integrate real-time data from your HR software or systems to keep your reports updated and accurate. This allows you to make quick decisions based on the most current information available.
Why You’ll Love the Human Resources Stakeholder Reporting KPI Dashboard in Excel

✅ Real-Time HR Data
Monitor essential HR metrics in real time, allowing you to make informed decisions and report accurate data to stakeholders without delays.
✅ Improve Employee Retention
Track employee retention and turnover rates to identify trends and take corrective actions. Optimize retention strategies and create a more engaged workforce.
✅ Measure Employee Performance
Track employee performance metrics and identify high performers or areas for improvement. Use this data to enhance employee engagement and drive performance improvements.
✅ Streamline HR Reporting
Generate automated reports and present HR data in an easy-to-understand format. Share insights with stakeholders to drive better decision-making across your organization.
✅ Customizable & Scalable
Adapt the dashboard to meet the specific HR needs of your organization. Add custom KPIs, change the layout, and make it scalable for your growing business.
What’s Inside the Human Resources Stakeholder Reporting KPI Dashboard in Excel?
Comprehensive KPI Tracking: Monitor HR metrics such as headcount, turnover, and retention rates.
Employee Retention & Turnover Analysis: Analyze retention and turnover trends to optimize employee engagement.
Performance Metrics Monitoring: Track employee productivity, performance reviews, and goal completion.
Time-Based Reporting: Generate monthly, quarterly, or annual HR performance reports.
Customizable Dashboard: Tailor the dashboard to meet your HR department’s needs.
Real-Time Data Integration: Integrate data from HR systems for updated reporting.
How to Use the Human Resources Stakeholder Reporting KPI Dashboard in Excel
1️⃣ Download the Template: Access the Human Resources Stakeholder Reporting KPI Dashboard in Excel instantly.
2️⃣ Set Up Your KPIs: Input data for KPIs such as employee retention, turnover rates, and performance metrics.
3️⃣ Monitor HR Performance: Track employee engagement, performance, and retention in real-time.
4️⃣ Generate Reports: Use time-based reporting to generate monthly, quarterly, or yearly reports.
5️⃣ Make Data-Driven Decisions: Leverage insights from the dashboard to improve HR strategy, enhance employee engagement, and optimize workforce management.
Who Can Benefit from the Human Resources Stakeholder Reporting KPI Dashboard in Excel?
🔹 HR Managers & Department Heads
🔹 Business Owners & Executives
🔹 Employee Relations & Engagement Teams
🔹 Recruitment & Talent Acquisition Managers
🔹 Small & Medium Enterprises (SMBs)
🔹 Large Corporations with Extensive HR Teams
🔹 HR Consultants & Analysts
Optimize your HR reporting process with the Human Resources Stakeholder Reporting KPI Dashboard in Excel. Track essential metrics, monitor employee performance, and generate data-driven reports for better decision-making.
Click here to read the Detailed blog post
Visit our YouTube channel to learn step-by-step video tutorials
Youtube.com/@PKAnExcelExpert


















Reviews
There are no reviews yet.