



he Human Resources Operations KPI Dashboard in Excel is a comprehensive tool designed to help HR managers, operations teams, and business leaders track, manage, and optimize key HR performance metrics. This Excel-based dashboard provides a real-time view of vital HR KPIs, including employee turnover, retention rates, recruitment performance, training effectiveness, and overall workforce productivity.
With this dashboard, HR teams can monitor the effectiveness of their recruitment, employee development, and retention strategies. The user-friendly interface and powerful data visualization tools help you gain actionable insights into your workforce operations, allowing you to improve HR practices, increase employee engagement, and foster a productive work environment.
Key Features of the Human Resources Operations KPI Dashboard in Excel
📊 Employee Turnover & Retention Rates
Track employee turnover and retention rates over time. Understand trends and identify areas where retention strategies need to be improved to reduce turnover.
📈 Recruitment Performance Tracking
Monitor key recruitment metrics, such as time-to-hire, cost-per-hire, and application-to-interview ratios. Evaluate the effectiveness of your recruitment campaigns and hiring processes.
📅 Training & Development Metrics
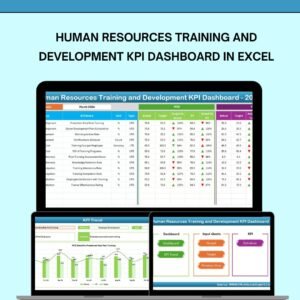
Track the effectiveness of employee training and development programs. Measure the number of training hours, participation rates, and improvements in employee skills.
⚙️ Workforce Productivity Analysis
Evaluate employee productivity by tracking KPIs such as performance appraisal scores, output levels, and overall contributions to the company’s goals.
🔑 Employee Satisfaction & Engagement
Measure employee satisfaction through metrics like engagement surveys, feedback scores, and participation in wellness or team-building activities. Use this data to improve overall employee morale.
📉 Customizable & Scalable
Customize the dashboard to reflect the specific HR metrics that matter most to your organization. Scale the dashboard to fit your business size, from small businesses to large corporations.
Why You’ll Love the Human Resources Operations KPI Dashboard in Excel

✅ Comprehensive HR Data Tracking
Track all vital HR KPIs in one place. From recruitment to training to employee satisfaction, monitor every key aspect of your HR operations to optimize performance.
✅ Improve Retention & Reduce Turnover
Use turnover and retention metrics to identify potential areas of concern and implement strategies to improve employee engagement and reduce turnover rates.
✅ Optimize Recruitment & Hiring
Monitor the effectiveness of your recruitment efforts and make data-driven decisions to streamline hiring processes, reduce hiring costs, and improve time-to-hire.
✅ Enhance Employee Training & Development
Evaluate the success of training and development programs and track how they contribute to employee growth and productivity.
✅ Data-Driven HR Decisions
Leverage the insights provided by the dashboard to make informed HR decisions, optimize employee management, and improve overall organizational performance.
What’s Inside the Human Resources Operations KPI Dashboard in Excel?
Employee Turnover & Retention Rates: Track and manage employee turnover and retention.
Recruitment Performance Tracking: Monitor hiring metrics like time-to-hire and cost-per-hire.
Training & Development Metrics: Track training participation, effectiveness, and improvements.
Workforce Productivity Analysis: Measure employee performance and productivity.
Employee Engagement & Satisfaction: Track employee feedback, satisfaction, and participation in activities.
Customizable KPIs: Tailor the dashboard to your specific HR needs and metrics.
How to Use the Human Resources Operations KPI Dashboard in Excel
1️⃣ Download the Template: Get instant access to the Human Resources Operations KPI Dashboard in Excel.
2️⃣ Input Your Data: Enter your HR data for key metrics such as turnover, recruitment performance, and training outcomes.
3️⃣ Monitor KPIs & Performance: Track key HR KPIs and monitor workforce productivity and engagement.
4️⃣ Analyze Trends & Insights: Use data visualizations to track trends over time and identify areas for improvement.
5️⃣ Optimize HR Operations: Use the insights from the dashboard to enhance your HR practices and improve employee engagement.
Who Can Benefit from the Human Resources Operations KPI Dashboard in Excel?
🔹 HR Managers & HR Teams
🔹 Operations & Business Leaders
🔹 Recruitment & Talent Acquisition Teams
🔹 Employee Training & Development Teams
🔹 Small & Medium Enterprises (SMBs)
🔹 Large Corporations with Complex HR Operations
🔹 Data Analysts & HR Consultants
Track and optimize your HR operations with the Human Resources Operations KPI Dashboard in Excel. Improve recruitment, training, retention, and overall workforce productivity, all in one place.
Click here to read the Detailed blog post
Visit our YouTube channel to learn step-by-step video tutorials
Youtube.com/@PKAnExcelExpert
Compatibility and Requirements
- Works in Microsoft Excel desktop (Excel 2016 or later, or Microsoft 365).
- New to Excel? Microsoft’s free Excel for Windows training.
Frequently Asked Questions
Which HR KPIs does this dashboard track?
It tracks employee turnover and retention, recruitment metrics such as time-to-hire and cost-per-hire, training participation and effectiveness, workforce productivity, and employee satisfaction and engagement.
Can I measure recruitment performance?
Yes. You can follow time-to-hire, cost-per-hire and application-to-interview ratios to judge your hiring process.
Can I track training programs?
Yes. You can record training hours, participation rates and skill improvements for your training and development programs.
Can I change the KPIs?
Yes. You can tailor the dashboard to your own HR needs and metrics.
Related HR KPI Dashboards
- Human Resources (HR) KPI Dashboard in Excel: a general HR KPI dashboard
- Human Resources Employee Retention KPI Dashboard in Excel: focus on turnover and retention
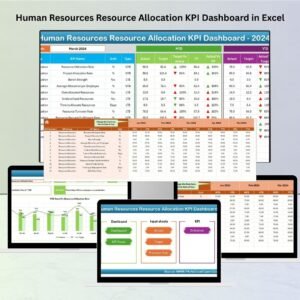
- Human Resources Resource Allocation KPI Dashboard in Excel: see how staff are assigned
- Human Resources (HR) KPI Dashboard in Power BI: HR KPIs in Power BI
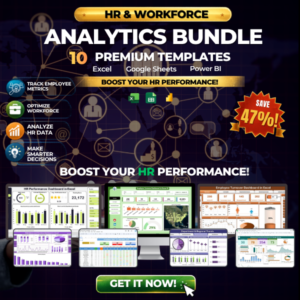
- HR & Workforce Analytics Bundle: 10 HR templates in Excel, Google Sheets and Power BI
Browse all Excel KPI dashboards or the Excel HR and payroll templates.






























Reviews
There are no reviews yet.