Key Features of Profitability Analysis KPI Dashboard in Google Sheets
Unlock powerful insights into your business profitability with the Profitability Analysis KPI Dashboard in Google Sheets. This ready-to-use digital template is designed for effortless analysis, enabling you to track key performance indicators (KPIs) with precision and clarity. Built on Google Sheets, it offers seamless accessibility and easy customization to fit your unique business needs.
Here’s what makes this dashboard a must-have tool:Profitability Analysis KPI Dashboard in Google Sheets
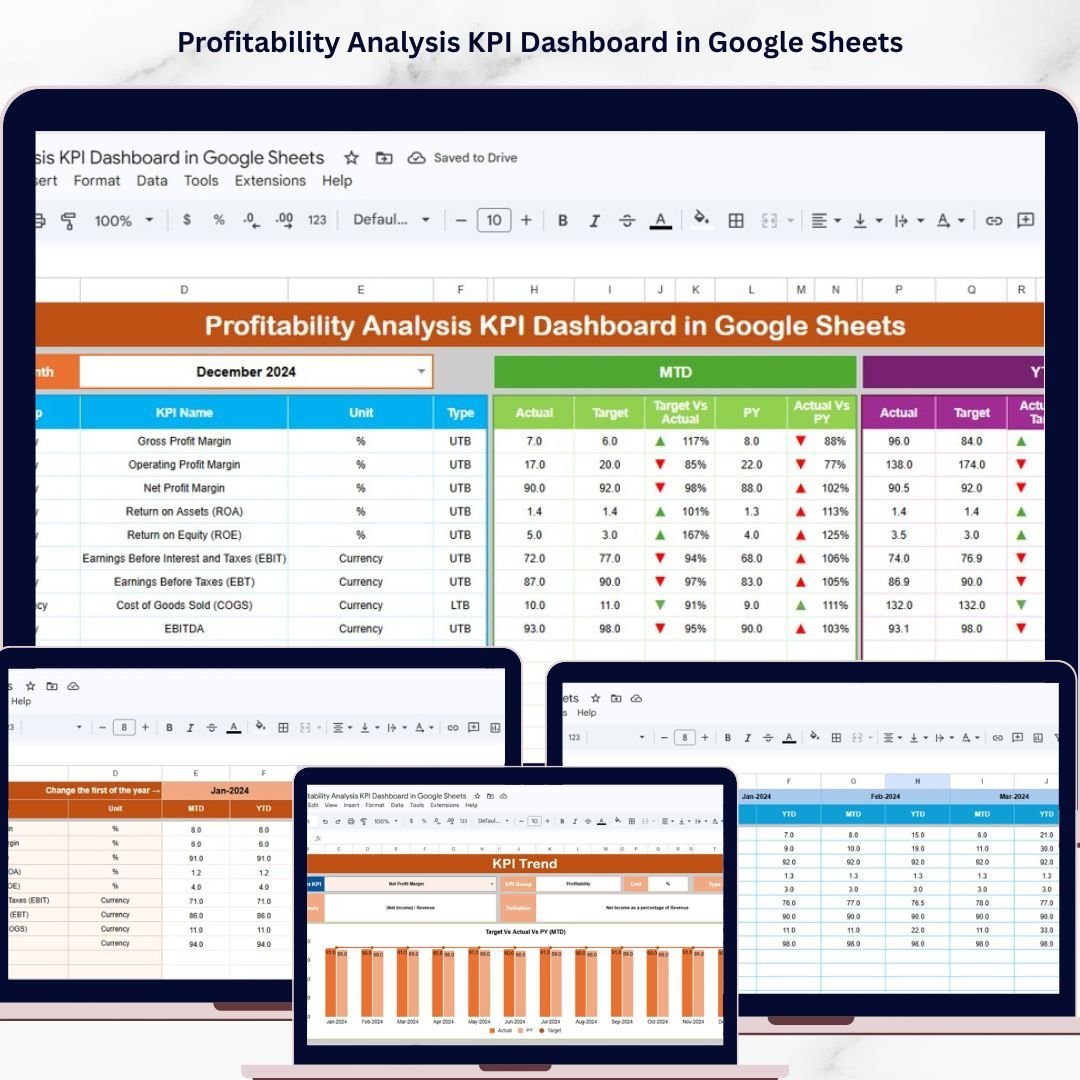
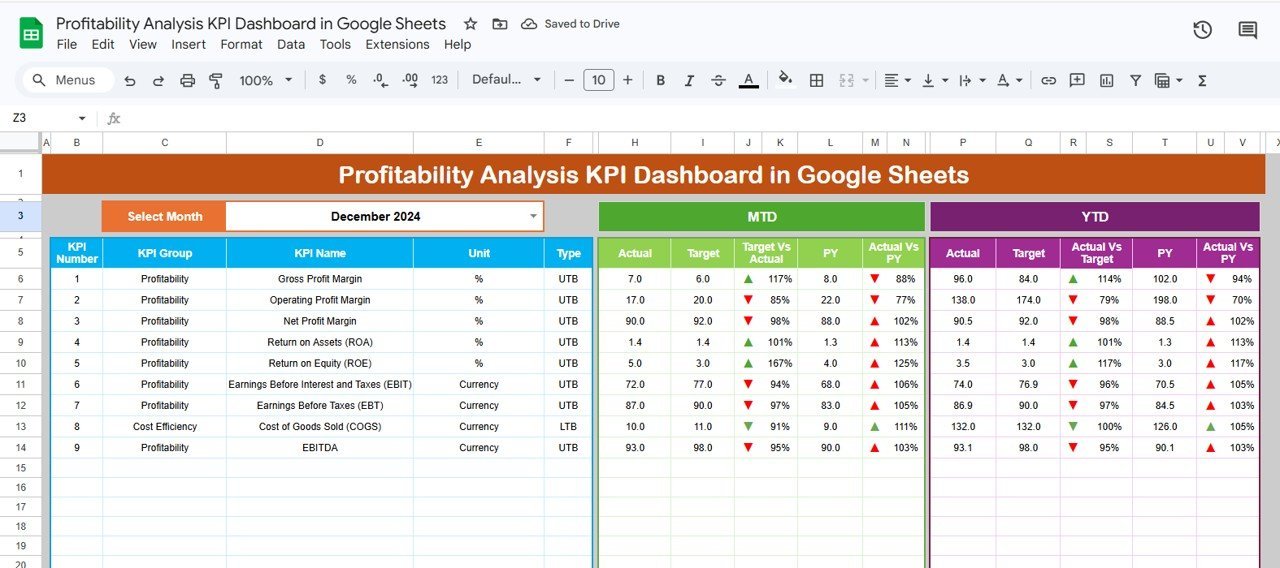
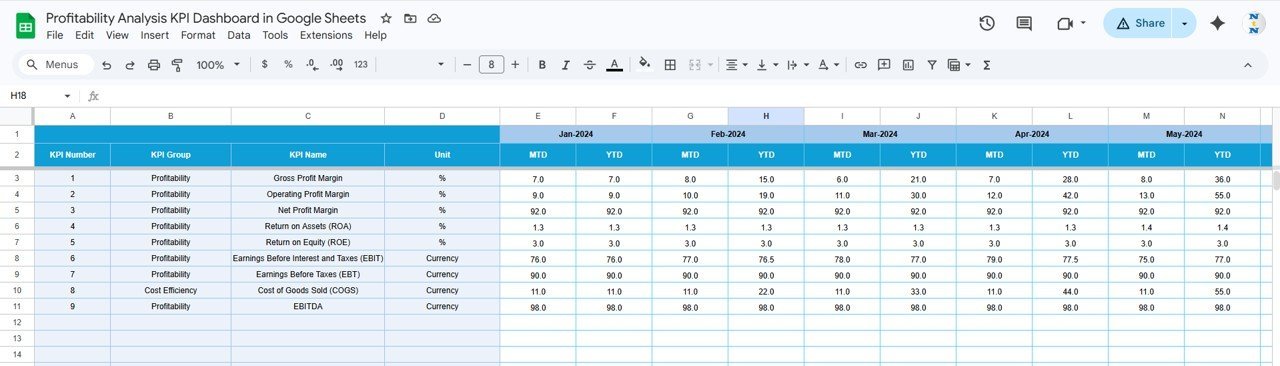
📊 Comprehensive Dashboard Sheet: View all your KPIs at a glance with dynamic month selection via a dropdown menu. Monitor MTD (Month-to-Date) and YTD (Year-to-Date) actuals, targets, and previous year data with vivid conditional formatting and intuitive up/down arrow indicators for quick performance evaluation.
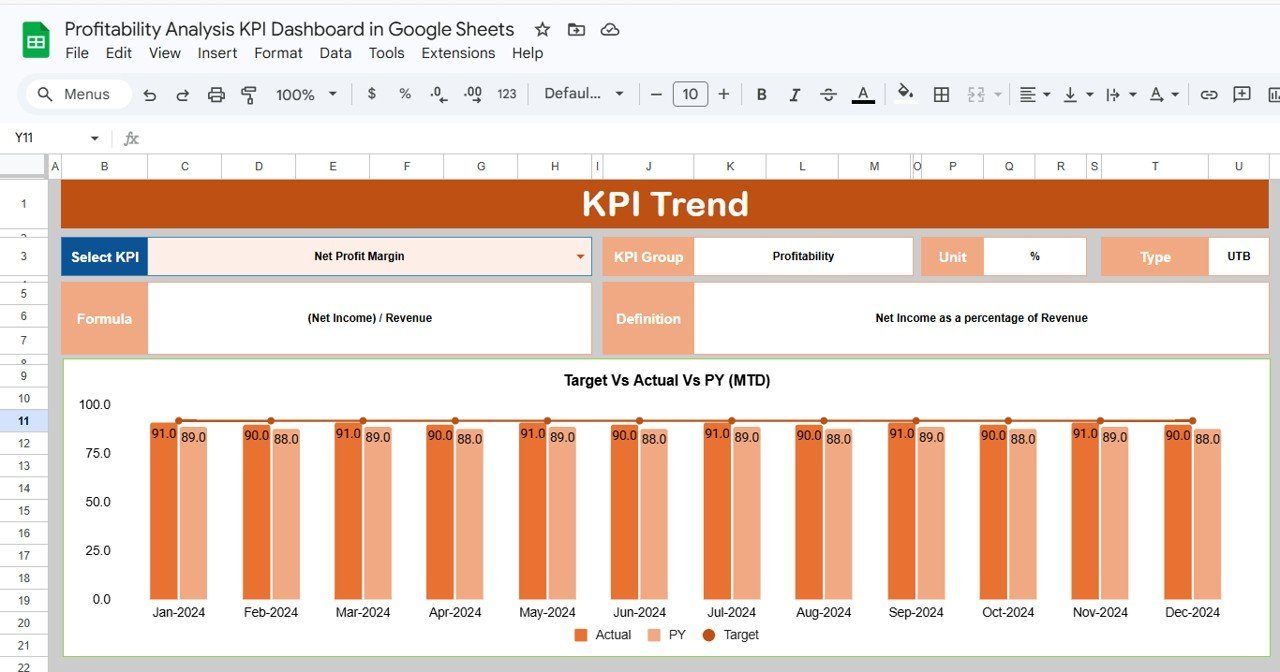
📈 KPI Trend Sheet: Analyze trends with interactive charts that compare Actual, Target, and Previous Year data for each KPI. Easily select KPIs from a dropdown and get detailed information including KPI group, unit, formula, and performance type (Lower the Better or Upper the Better).
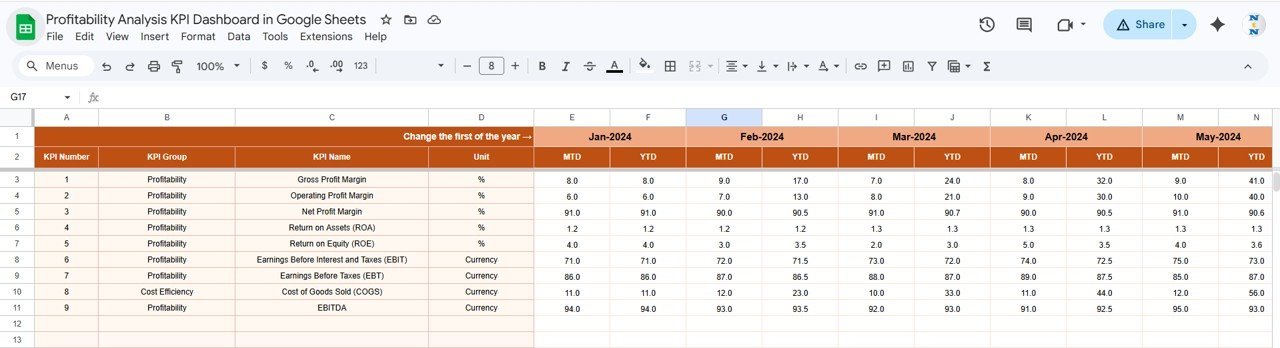
📝 Data Input Sheets: Four dedicated sheets for entering Actual, Target, and Previous Year numbers plus KPI definitions ensure your data is organized and reliable, supporting accurate calculation and reporting.
⚙️ User-Friendly Interface: Simple dropdowns and clearly labeled input areas make data entry and dashboard navigation intuitive, saving time and reducing errors.Profitability Analysis KPI Dashboard in Google Sheets
💡 Conditional Formatting & Visual Cues: Instantly spot performance trends and gaps with color-coded metrics and arrows that highlight deviations from targets and past performance.Profitability Analysis KPI Dashboard in Google Sheets
What’s Inside the Profitability Analysis KPI Dashboard in Google Sheets
This dynamic template includes six meticulously designed worksheets to cover every aspect of profitability tracking:
📊 Dashboard Sheet Tab: The main hub showing all KPIs with monthly selection capability, displaying MTD and YTD actuals, targets, and previous year comparisons with conditional formatting.
📈 KPI Trend Sheet Tab: Select any KPI to see detailed trends and definitions along with visual charts for quick analysis.
📝 Actual Numbers Input Sheet: Enter your actual performance data here, with month selection functionality to align data correctly.
🎯 Target Number Input Sheet: Input your monthly KPI targets for accurate goal tracking.
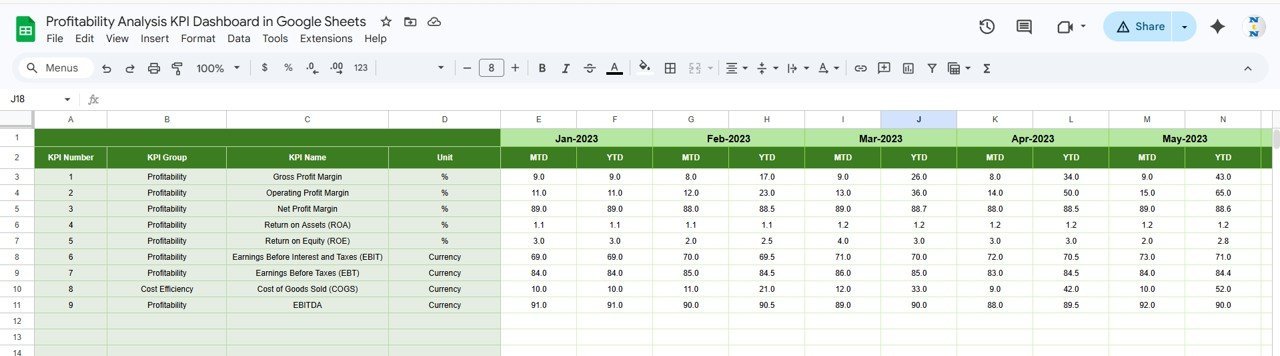
📅 Previous Year Number Sheet Tab: Record last year’s corresponding KPI numbers to compare and analyze growth or decline.
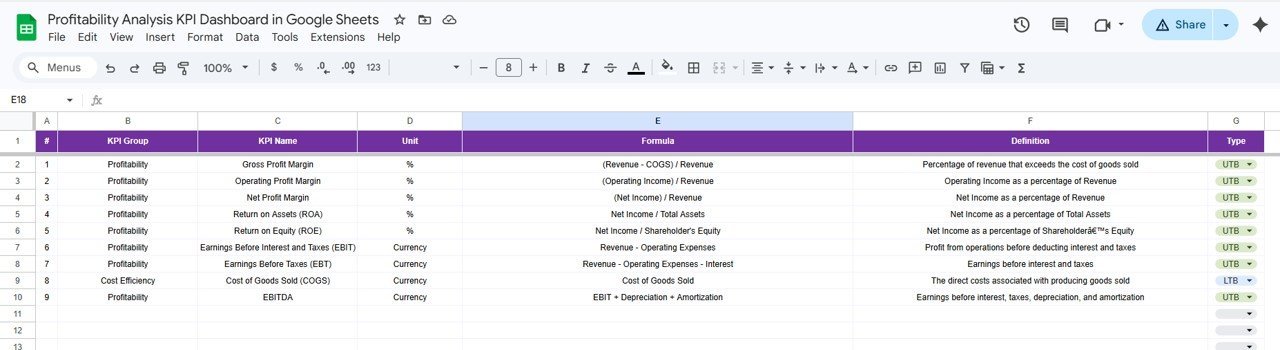
📚 KPI Definition Sheet Tab: Define each KPI’s name, group, unit, formula, and type (Lower the Better/Upper the Better) for precise understanding and calculation.Profitability Analysis KPI Dashboard in Google Sheets
How to Use the Profitability Analysis KPI Dashboard in Google Sheets
Getting started with this dashboard is straightforward and requires no advanced technical skills. Follow these simple steps:
📝 Step 1: Open the Google Sheets template and input the first month of your fiscal year in the Actual Numbers Input sheet.
📊 Step 2: Enter your actual performance data for each KPI for the selected months.
🎯 Step 3: Fill in your target numbers in the Target Number Input sheet to set your performance goals.
📅 Step 4: Add last year’s data in the Previous Year Number sheet for comparative analysis.
📚 Step 5: Review and update the KPI Definition sheet to ensure all KPIs have proper definitions, formulas, and performance types.
📈 Step 6: Use the Dashboard sheet to select the month you want to analyze and view your profitability KPIs with real-time visual indicators.
🔍 Step 7: Dive deeper into trends with the KPI Trend sheet, selecting KPIs to monitor their performance over time.
💡 Step 8: Regularly update your input sheets as new data becomes available to keep your dashboard accurate and actionable.
Who Can Benefit from This Profitability Analysis KPI Dashboard in Google Sheets
This dashboard is an indispensable tool for a wide range of professionals and organizations aiming to optimize profitability and performance:
👨💼 Business Owners & Entrepreneurs: Gain clear insights into your company’s profitability drivers to make informed strategic decisions.
📊 Financial Analysts & Controllers: Streamline your KPI tracking and reporting with automated dashboards that save time and enhance accuracy.
🏢 Managers & Department Heads: Monitor team or department profitability performance against targets and historical data.
📈 Consultants & Advisors: Use this template as a professional tool to deliver actionable profitability analysis to clients.
💻 Startups & SMEs: Manage and track your financial health effectively without investing in expensive software.
📚 Students & Learners: Practice KPI analysis and dashboard design with a practical, real-world template.
🌍 Remote Teams: Collaborate easily through Google Sheets, allowing multiple users simultaneous access and updates.
🔧 Anyone Needing Profitability Insights: Whether you’re an accountant or business strategist, this dashboard simplifies complex data into actionable insights.
Click here to read the Detailed blog post.
Visit our YouTube channel to learn step-by-step video tutorials


Reviews
There are no reviews yet.