


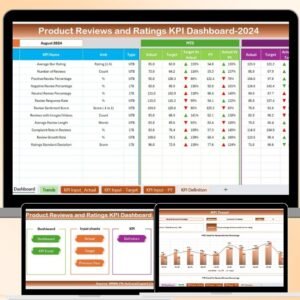
The Product Reviews and Ratings KPI Dashboard in Excel is a powerful tool designed to help businesses track, manage, and analyze customer feedback and product ratings. This Excel-based dashboard provides a centralized platform for monitoring key performance indicators (KPIs) such as average ratings, review counts, sentiment analysis, and more, enabling you to make data-driven decisions that improve your products and services.
With real-time data integration and easy-to-use features, this dashboard allows product managers, marketing teams, and customer service representatives to gain insights into customer satisfaction, identify areas for improvement, and take actionable steps to enhance product offerings.
Key Features of the Product Reviews and Ratings KPI Dashboard in Excel
📊 Customer Feedback Tracking
Monitor customer feedback by tracking product reviews and ratings across multiple platforms. Stay updated on the overall sentiment and review trends.
📈 Average Rating Calculation
Track the average ratings for each product and compare performance over time. This allows you to identify top-performing products and areas that need attention.
🔄 Review Sentiment Analysis
Analyze the sentiment of product reviews (positive, negative, or neutral) to understand customer satisfaction and identify common themes in feedback.
📝 Review Count Monitoring
Track the total number of reviews received for each product. This helps you measure customer engagement and identify products with high customer interest.
⚙️ Customizable KPIs & Metrics
Tailor the dashboard to include the KPIs that are most relevant to your product performance analysis. Add custom metrics like review velocity, detailed sentiment analysis, or ratings distribution.
📅 Time-Based Analysis
Monitor product reviews and ratings over different time periods (daily, weekly, monthly). Use historical data to assess product performance and track improvements.
Why You’ll Love the Product Reviews and Ratings KPI Dashboard in Excel

✅ Centralized Feedback Monitoring
Track all customer feedback in one place, making it easy to monitor and manage reviews for multiple products and platforms.
✅ Identify Strengths & Weaknesses
Track average ratings, sentiment, and review count to quickly identify your product’s strengths and areas where improvements are needed.
✅ Improve Product Development
Use feedback and ratings to inform product development and enhance your offerings. Identify recurring issues and address them to improve customer satisfaction.
✅ Boost Customer Engagement
By tracking review activity, you can identify which products are most engaging to customers and leverage this information to improve customer retention.
✅ Make Data-Driven Decisions
Leverage the insights from the dashboard to make informed decisions about product marketing, customer support, and future product innovations.
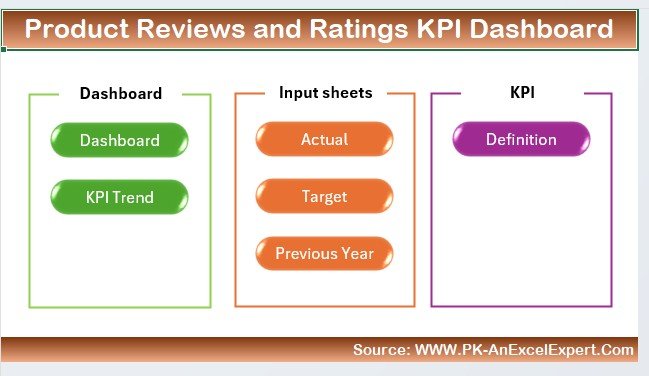
What’s Inside the Product Reviews and Ratings KPI Dashboard in Excel?
-
Customer Feedback Tracking: Monitor all reviews and ratings in one centralized location.
-
Average Rating Calculation: Track average ratings for each product over time.
-
Review Sentiment Analysis: Understand customer sentiment through positive, neutral, or negative reviews.
-
Review Count Monitoring: Keep track of the total number of reviews for each product.
-
Customizable KPIs: Adjust the dashboard to track any specific product performance metrics.
-
Time-Based Analysis: Assess performance over different time periods to measure improvements.
How to Use the Product Reviews and Ratings KPI Dashboard in Excel
1️⃣ Download the Template: Instantly access the Product Reviews and Ratings KPI Dashboard in Excel.
2️⃣ Input Product Data: Enter your product review and rating data into the dashboard.
3️⃣ Monitor KPIs & Performance: Track key metrics such as average ratings, review count, and sentiment analysis.
4️⃣ Analyze Trends & Patterns: Use time-based analysis to track product performance over time.
5️⃣ Make Data-Driven Decisions: Use the insights from the dashboard to improve your products and customer satisfaction.
Who Can Benefit from the Product Reviews and Ratings KPI Dashboard in Excel?
🔹 Product Managers
🔹 Marketing Teams
🔹 Customer Service Representatives
🔹 E-commerce Platforms & Retailers
🔹 Brand Managers & Customer Experience Teams
🔹 Businesses Looking to Track Customer Feedback
🔹 Companies Focused on Product Development & Improvement
Improve your product offerings and customer experience with the Product Reviews and Ratings KPI Dashboard in Excel. Monitor product performance, track customer feedback, and make data-driven decisions that drive business growth.
Click here to read the Detailed blog post
Visit our YouTube channel to learn step-by-step video tutorials
Youtube.com/@PKAnExcelExpert


Reviews
There are no reviews yet.