


The Cross-Selling KPI Dashboard in Excel is an essential tool for businesses looking to optimize their cross-selling strategies. This Excel-based dashboard allows businesses to track key performance indicators (KPIs) related to cross-selling initiatives, monitor sales performance, and identify opportunities to increase revenue by offering complementary products or services to existing customers.
This powerful tool enables sales teams, marketing managers, and business owners to measure the success of cross-selling campaigns, assess customer behavior, and determine the most effective cross-selling opportunities. By leveraging real-time data and clear visualizations, businesses can enhance their sales strategies, improve customer retention, and maximize revenue growth.
Key Features of the Cross-Selling KPI Dashboard in Excel
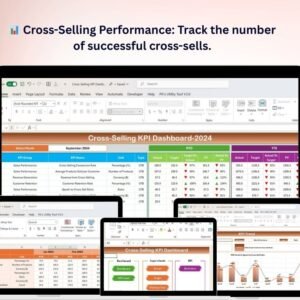
📊 Cross-Selling Performance Tracking
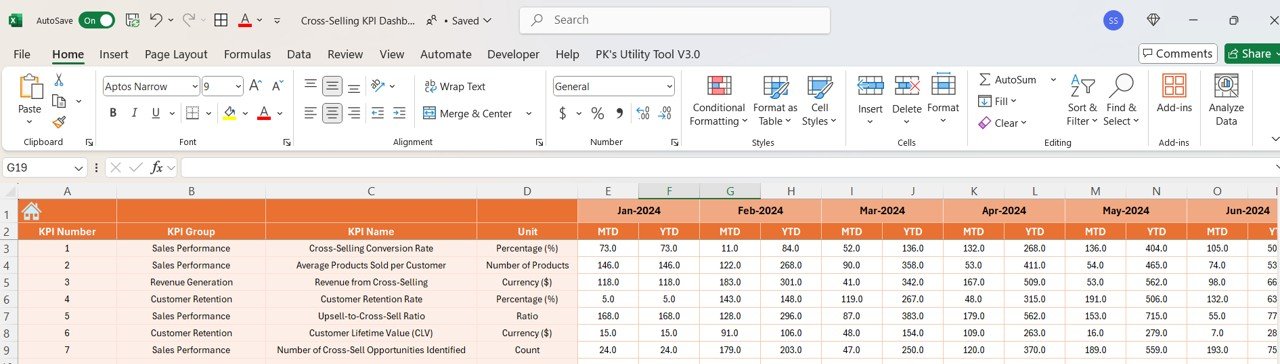
Monitor the effectiveness of cross-selling campaigns by tracking key metrics such as the number of successful cross-sells, sales conversion rate, and revenue generated from cross-selling efforts.
📈 Sales Conversion Analysis
Evaluate the success rate of cross-selling opportunities by measuring how often a recommended product or service is accepted by customers. This helps you understand the effectiveness of your sales tactics.
💡 Customer Behavior Insights
Analyze customer purchase patterns to identify potential cross-selling opportunities. The dashboard enables you to see which products or services are frequently purchased together, helping you tailor cross-sell offers accordingly.
📅 Time-Based Performance Metrics
Track cross-selling performance over different time periods (daily, weekly, monthly). Analyze trends, track improvements, and adjust strategies based on time-based data analysis.
⚙️ Customizable KPIs & Metrics
Customize the dashboard to fit your unique business needs. Add relevant KPIs, modify sales targets, or adjust the layout to align with your organization’s sales strategy.
📈 Revenue Impact Tracking
Track the direct impact of cross-selling on revenue. Understand which products or services generate the highest revenue through cross-selling and adjust strategies to maximize profitability.
Why You’ll Love the Cross-Selling KPI Dashboard in Excel
✅ Optimize Cross-Selling Campaigns
Track key metrics to improve cross-selling campaigns and identify high-performing strategies that can be replicated across your organization.
✅ Improve Sales Conversion Rates
Analyze sales performance to identify opportunities for higher conversion rates and increased success in cross-selling efforts.
✅ Maximize Customer Value
By analyzing customer behaviors, you can deliver targeted offers, increasing customer value and enhancing the customer experience.
✅ Increase Revenue
Track and monitor the revenue generated from cross-selling activities to ensure that your business is maximizing its revenue potential.
✅ Customizable & Scalable
The dashboard is fully customizable, enabling businesses of all sizes to tailor the tool to their specific needs and goals. Whether you’re a small business or a large enterprise, this dashboard can scale to fit your requirements.
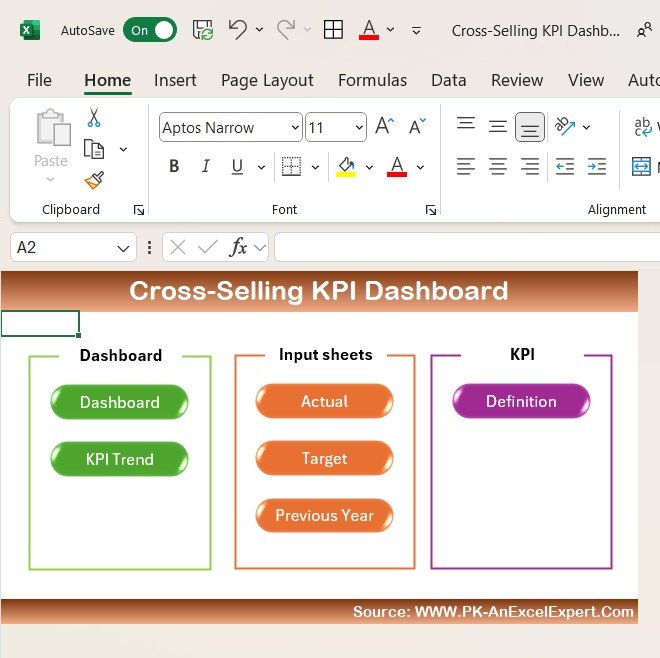
What’s Inside the Cross-Selling KPI Dashboard in Excel?
-
Cross-Selling Performance Tracking: Track the number of successful cross-sells and measure conversion rates.
-
Sales Conversion Analysis: Evaluate the effectiveness of cross-selling offers.
-
Customer Behavior Insights: Analyze customer purchase patterns to discover cross-selling opportunities.
-
Time-Based Performance Metrics: Monitor cross-selling performance over various time periods.
-
Customizable Features: Adjust KPIs and sales targets based on your business needs.
-
Revenue Impact Tracking: Track how cross-selling impacts revenue growth.
How to Use the Cross-Selling KPI Dashboard in Excel
1️⃣ Download the Template: Instantly access the Cross-Selling KPI Dashboard in Excel.
2️⃣ Enter Sales Data: Input your sales data, including customer purchases and cross-sell offers.
3️⃣ Track KPIs & Performance: Monitor conversion rates, cross-sell success, and revenue impact.
4️⃣ Analyze Trends: Use time-based data to identify trends and improve cross-selling strategies.
5️⃣ Optimize Strategies: Adjust your sales approach based on insights from the dashboard to increase revenue and customer satisfaction.
Who Can Benefit from the Cross-Selling KPI Dashboard in Excel?
🔹 Sales Managers & Teams
🔹 Marketing Professionals
🔹 Business Owners & Founders
🔹 Customer Success & Retention Teams
🔹 E-commerce & Retail Businesses
🔹 Small & Medium Enterprises (SMBs)
🔹 Large Corporations with Cross-Selling Initiatives
Maximize your sales and improve customer relationships with the Cross-Selling KPI Dashboard in Excel. Track, analyze, and optimize your cross-selling efforts to boost revenue and enhance the customer experience.
Click here to read the Detailed blog post
Visit our YouTube channel to learn step-by-step video tutorials
Youtube.com/@PKAnExcelExpert


Reviews
There are no reviews yet.