


The Product Review Dashboard in Power BI is a powerful tool designed to help businesses track and analyze product performance based on customer reviews. This interactive and customizable dashboard provides key insights into customer feedback, product ratings, and overall satisfaction. Whether you’re managing a small product line or a large portfolio, this dashboard helps you visualize product performance, identify improvement areas, and make data-driven decisions.
By connecting product review data from various sources, such as e-commerce platforms or customer surveys, this Power BI dashboard consolidates all information into easy-to-understand visualizations. It allows you to monitor trends, track sentiment, and evaluate product ratings in real-time, providing a comprehensive overview of how your products are performing in the market.
Key Features of the Product Review Dashboard in Power BI
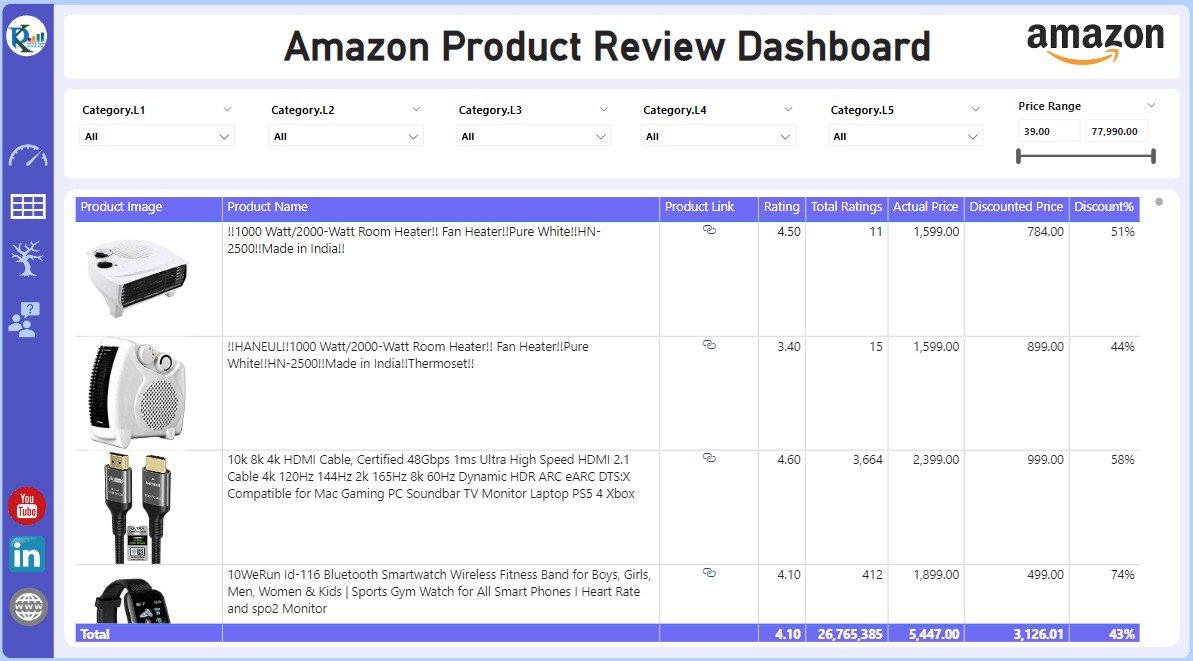
📊 Comprehensive Review Tracking: Monitor customer reviews, ratings, and feedback in one centralized dashboard.
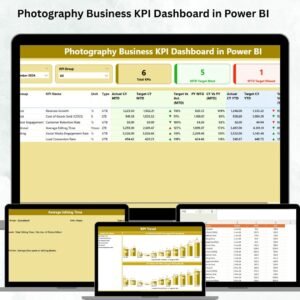
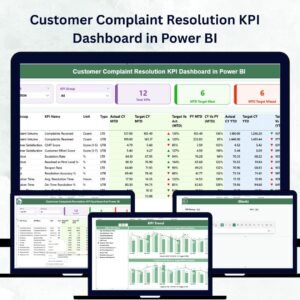
⚙️ Customizable KPIs: Adapt the dashboard to display the specific KPIs most relevant to your product review analysis, such as average ratings, number of reviews, and sentiment scores.
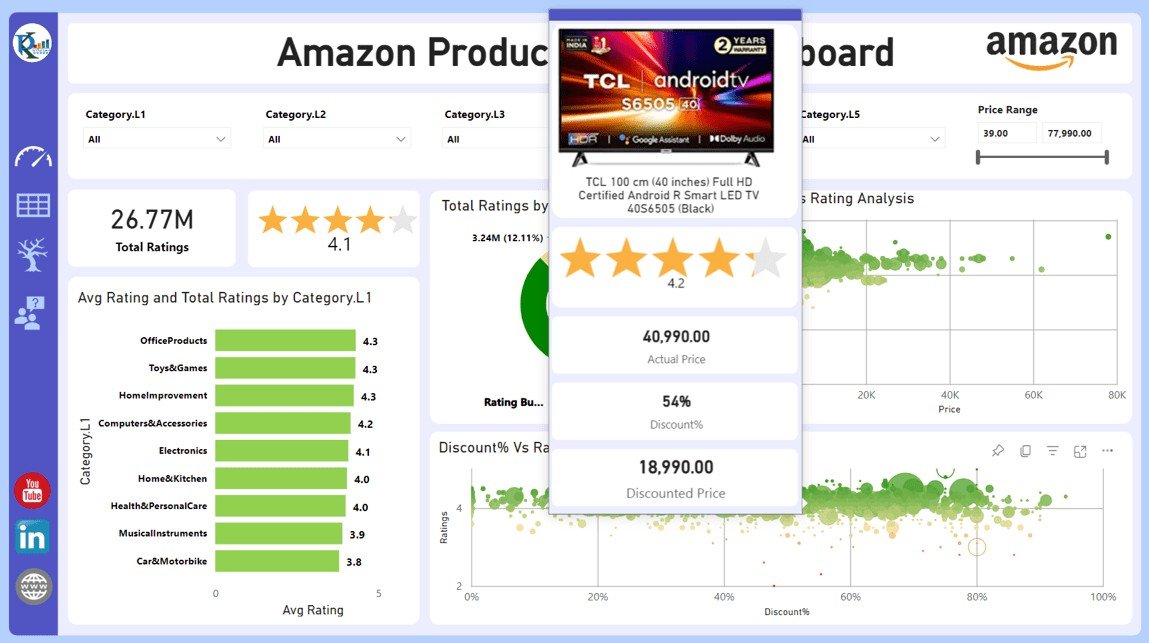
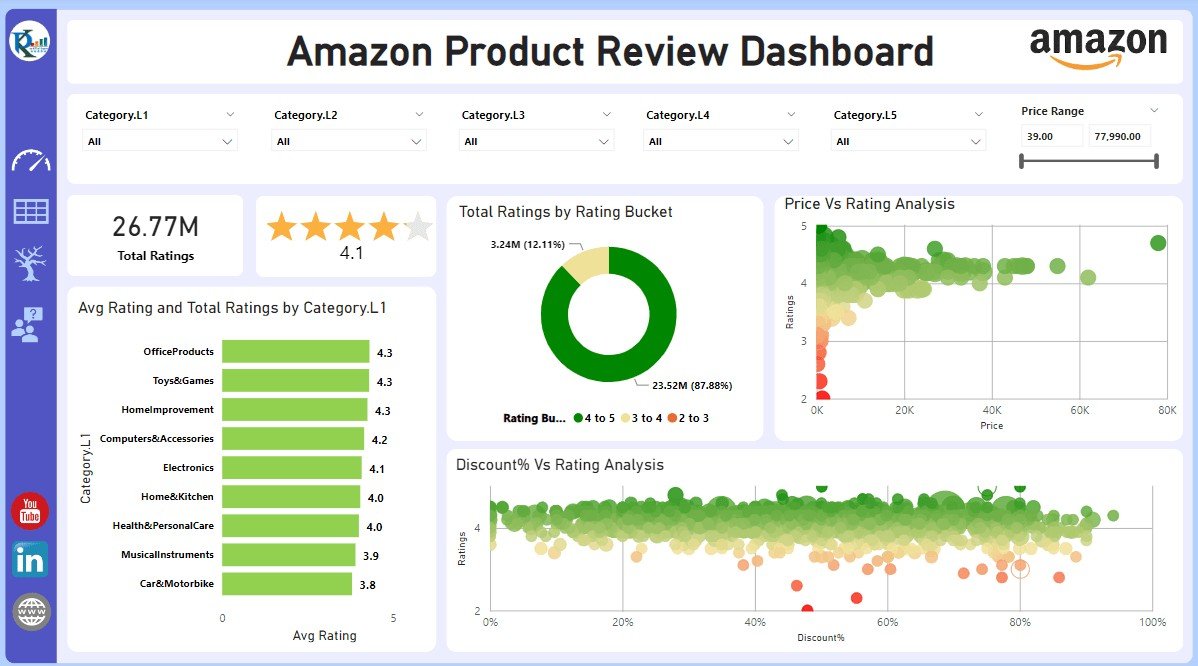
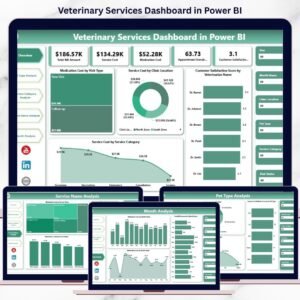
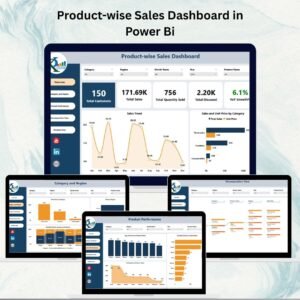
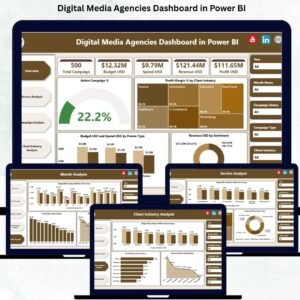
📈 Product Performance Visualization: Use charts and graphs to visualize product ratings and customer satisfaction over time.
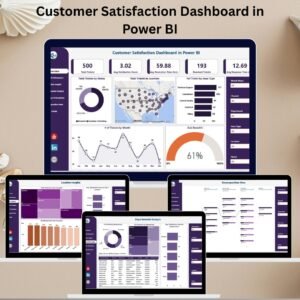
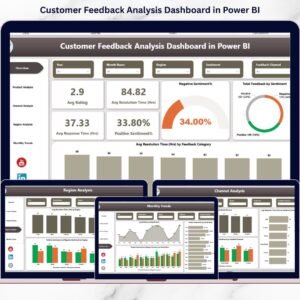
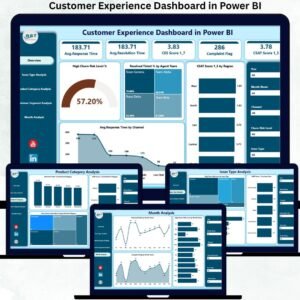
📉 Sentiment Analysis: Track customer sentiment and see how positive, negative, and neutral feedback is distributed across your products.
📅 Time-Based Trends: Analyze product review trends over specific periods to identify seasonal patterns or reactions to product updates.
🔄 Interactive Data Exploration: Filter by product categories, timeframes, or customer demographics to gain deeper insights into your product performance.
🧑💼 User-Friendly Interface: The simple and intuitive Power BI interface makes it easy for users of all experience levels to analyze and interpret product review data.
Why You’ll Love the Product Review Dashboard in Power BI
✅ Improves Customer Insights: Gain a deeper understanding of customer satisfaction, identify pain points, and see how products are performing.
✅ Data-Driven Decision Making: Make informed decisions based on real-time review and sentiment analysis data.
✅ Easy-to-Understand Visualizations: Use clear charts and graphs to easily interpret product ratings and trends.
✅ Customizable to Your Needs: Tailor the dashboard to suit your specific products and business goals.
✅ Enhances Product Development: Track feedback to guide product improvements and innovation.
What’s Inside the Product Review Dashboard in Power BI?
📊 Review and Rating Tracking: Monitor the number of reviews and average product ratings.
⚙️ Customizable KPIs: Track key metrics, such as sentiment scores, rating breakdowns, and review trends.
📈 Product Performance Charts: Use visual charts to analyze product ratings over time.
📉 Sentiment Distribution: Analyze the positive, negative, and neutral sentiment of customer reviews.
🔄 Interactive Filters: Filter data by product category, region, or time period for deeper insights.
How to Use the Product Review Dashboard in Power BI
1️⃣ Download the Power BI Dashboard – Get access to the Power BI file upon purchase.
2️⃣ Input Review Data: Connect your product review data sources (e-commerce platforms, surveys, etc.) to the Power BI dashboard.
3️⃣ Customize Your KPIs: Adjust the dashboard to display the metrics most relevant to your business goals.
4️⃣ Analyze and Monitor: Use the dashboard to track product performance and customer satisfaction in real-time.
5️⃣ Generate Reports: Create detailed reports and visualizations for leadership and stakeholders.
Who Can Benefit from the Product Review Dashboard in Power BI?
🔹 Product Managers
🔹 Marketing Teams
🔹 Customer Service Teams
🔹 E-commerce Businesses
🔹 Brand Managers
🔹 Data Analysts
🔹 Retailers
Gain a comprehensive view of your products’ performance with the Product Review Dashboard in Power BI, helping you enhance customer satisfaction and optimize your product offerings.
Click here to read the detailed blog post
Visit our YouTube channel to learn step-by-step video tutorials


Reviews
There are no reviews yet.