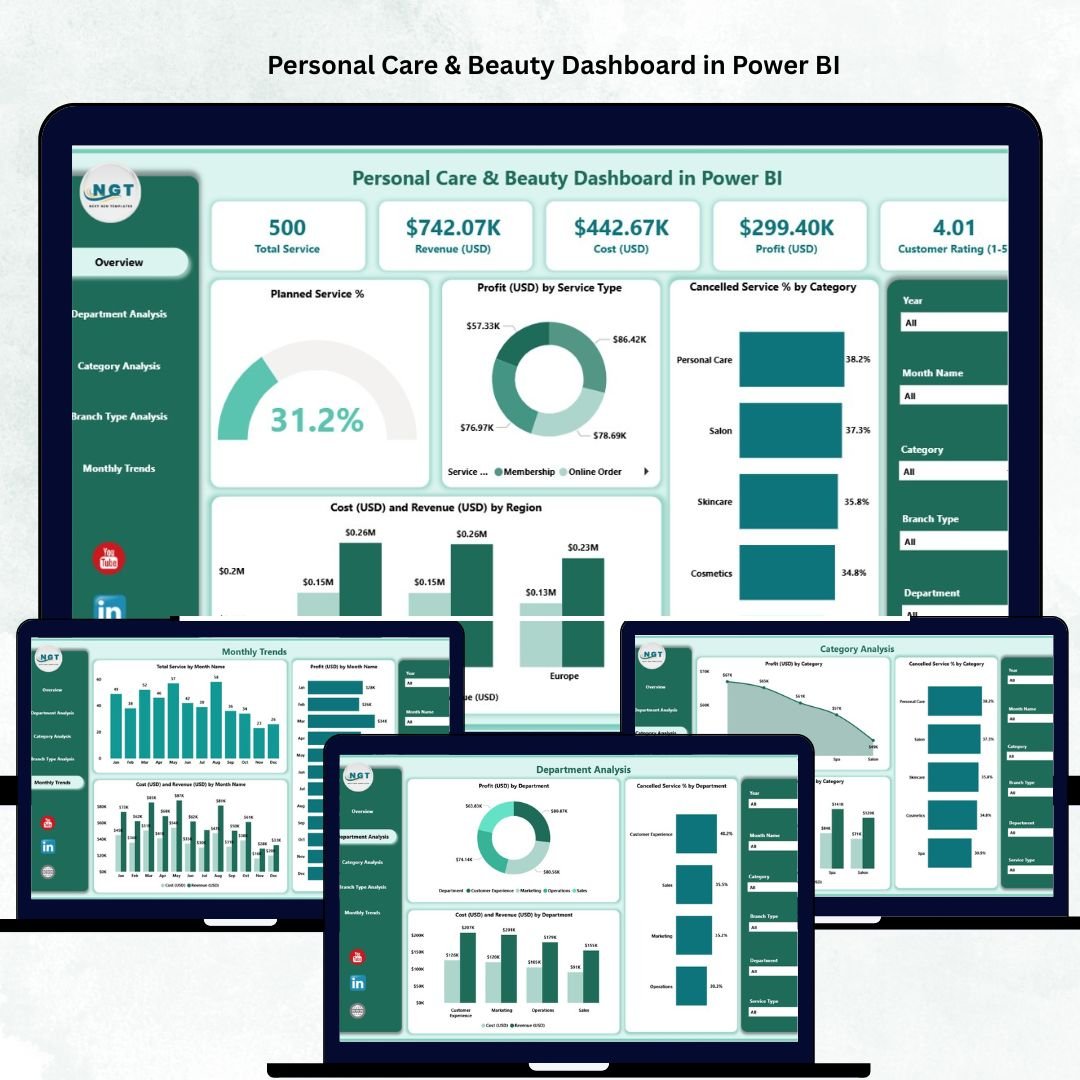
In the fast-growing beauty and wellness industry, every salon, spa, and cosmetic brand needs data-driven insights to stay competitive. The Personal Care & Beauty Dashboard in Power BI is a powerful analytical solution that transforms your operational, financial, and customer data into meaningful visual reports. 💄📊
Whether you run a single salon or manage a nationwide network of beauty centers, this Power BI dashboard gives you real-time visibility into your performance — helping you improve profitability, streamline operations, and boost customer satisfaction.
🌟 Key Features of the Personal Care & Beauty Dashboard in Power BI
💅 Comprehensive Overview Page:
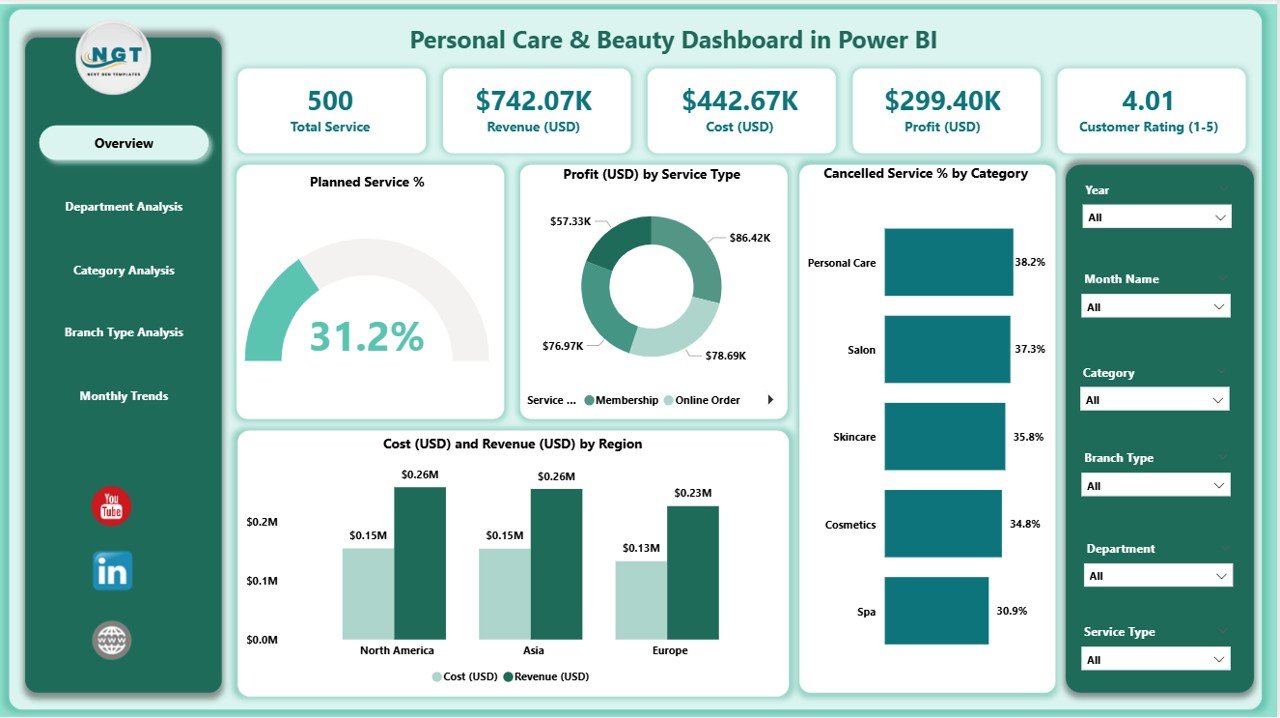
View your entire business performance at a glance with interactive visuals. Analyze key KPIs such as Planned Service %, Profit by Service Type, Cancelled Service Rate, Regional Costs, and Revenue by Branch.
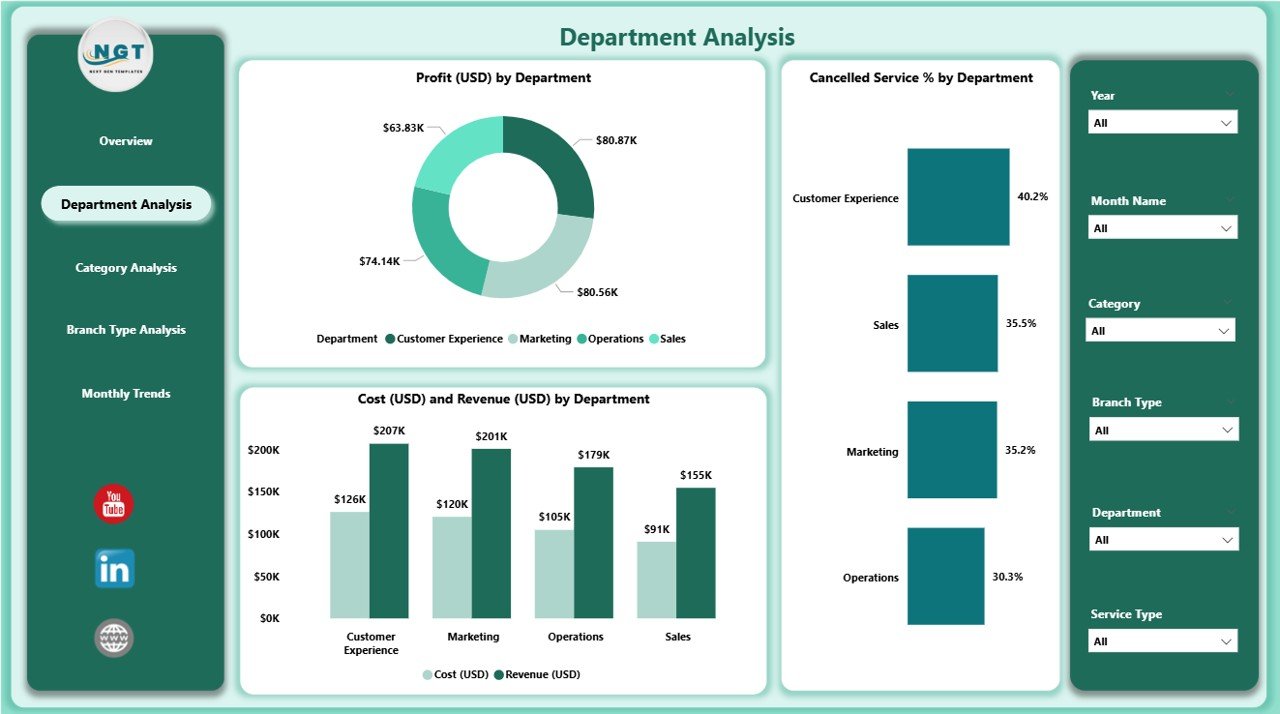
🏢 Department Analysis:
Get detailed insights into your departments — Haircare, Skincare, Makeup, and Spa. Evaluate profitability, cancellations, and financial performance side by side to pinpoint where your efforts yield the most results.
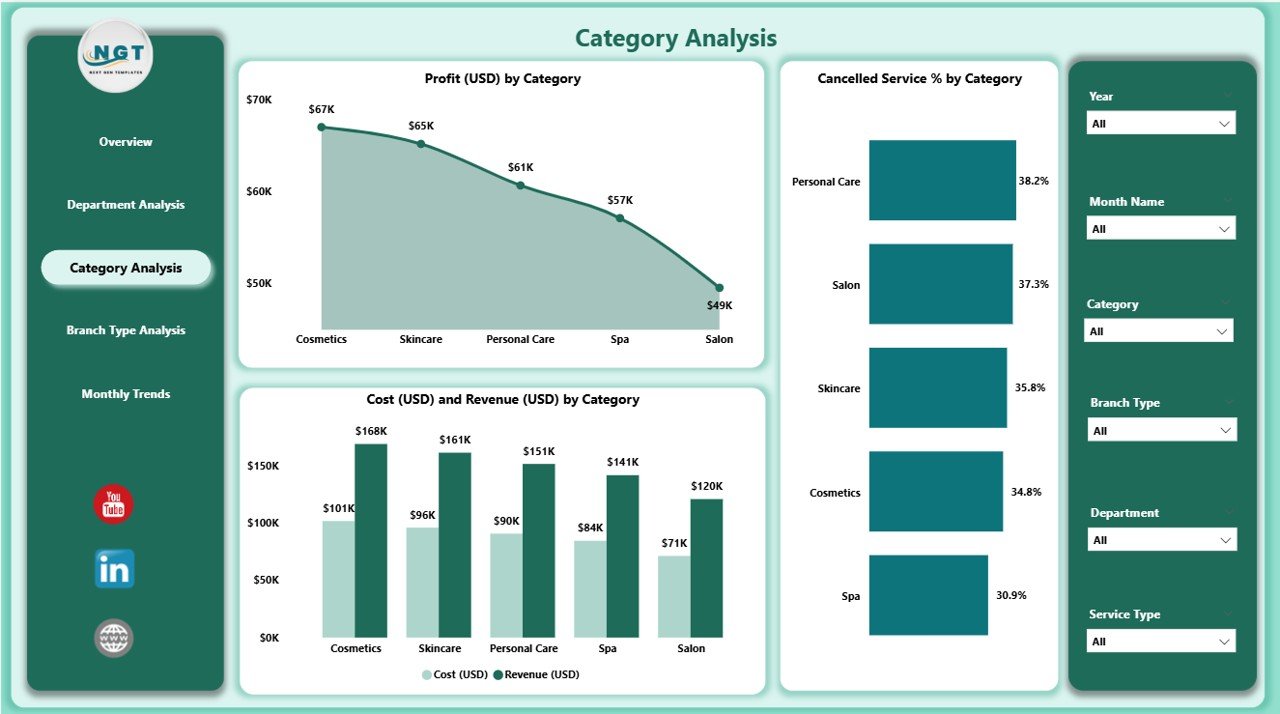
💄 Category Analysis:
Dive deep into product and service categories to identify your best-selling offerings and underperforming areas. Analyze Profit (USD), Cost (USD), and Cancelled Service % across multiple categories.
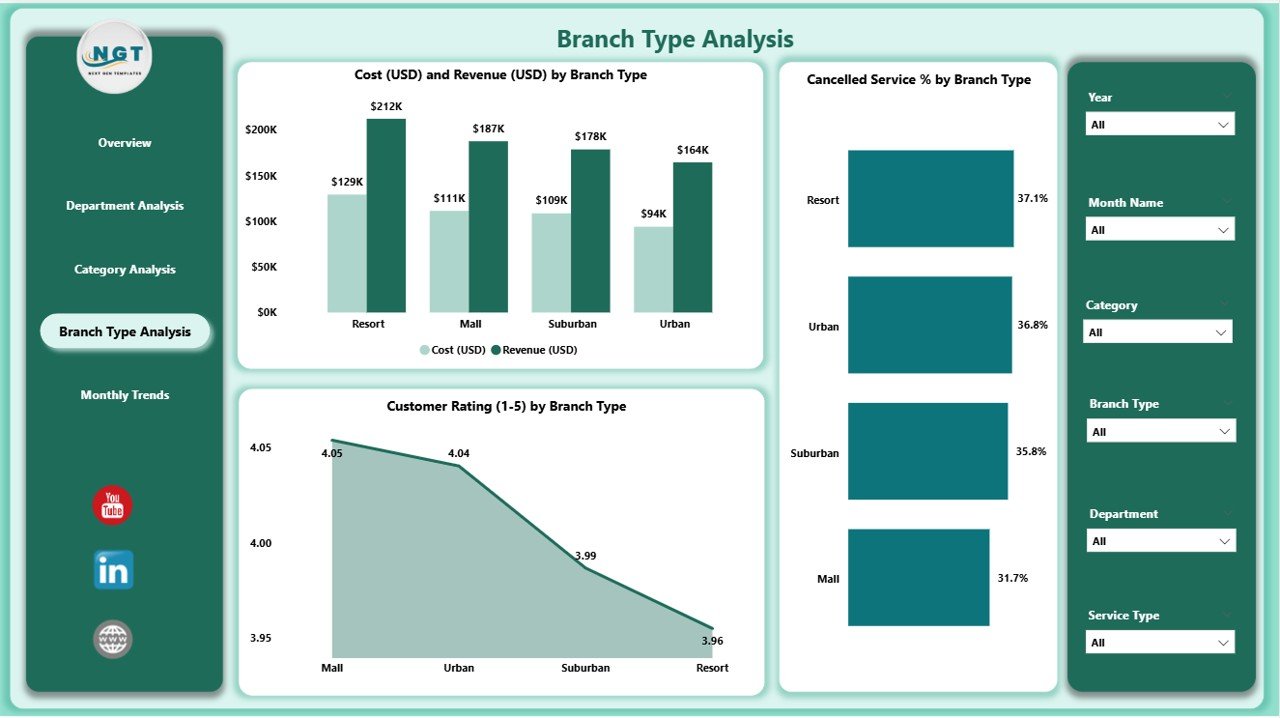
🏬 Branch Type Analysis:
Compare Flagship Salons, Franchise Stores, and Express Centers to understand which formats bring in the most profit and highest customer ratings.
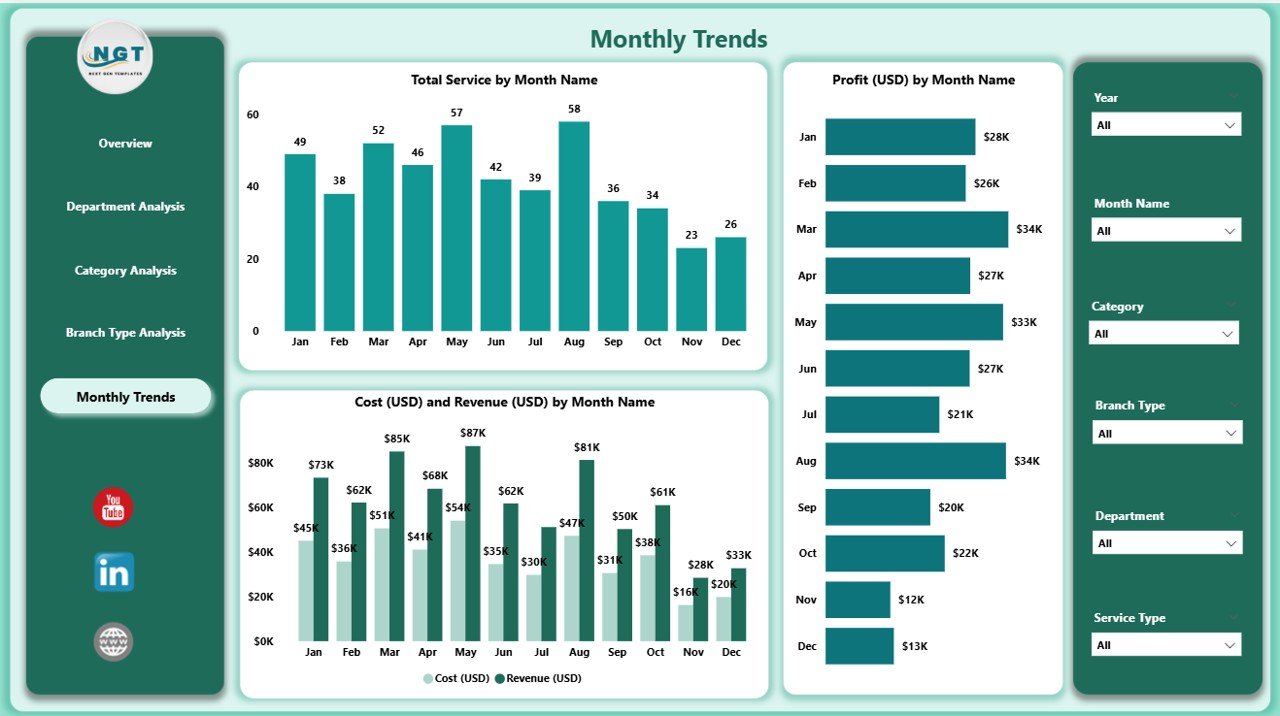
📆 Monthly Trends Page:
Monitor performance over time with charts for Profit (USD), Cost (USD), Revenue (USD), and Total Services by Month. Detect seasonal demand, track campaign impact, and forecast growth.
🧭 Smart Navigation & Filters:
Slicers allow instant filtering by date, branch, region, or service type — empowering managers to tailor insights instantly.
📦 What’s Inside the Dashboard
When you download the Personal Care & Beauty Dashboard in Power BI, you get:
✅ Five Analytical Pages: Overview, Department, Category, Branch Type, and Monthly Trends.
✅ Dynamic KPIs: Profit %, Revenue, Cost, Cancellations, and Service Ratings.
✅ Interactive Filters: Region, Month, Service Type, and Branch Selector.
✅ Linked Excel Data Source: Seamless connection for automatic updates.
✅ Customizable Visuals: Modify colors, charts, and KPIs to match your brand style.
✅ User-Friendly Interface: Designed for both professionals and non-technical users.
Each page is carefully structured to ensure that even complex data becomes simple, beautiful, and actionable.
🧭 How to Use the Personal Care & Beauty Dashboard in Power BI
🪄 Step 1: Connect your Excel or database file containing sales, cost, and service data.
🪄 Step 2: Open the Power BI file and refresh data for real-time updates.
🪄 Step 3: Use the slicers to filter by branch, service, month, or region.
🪄 Step 4: Review interactive charts to monitor profits, cancellations, and performance trends.
🪄 Step 5: Export or publish your dashboard to Power BI Service for collaboration.
No coding, no complicated setup — just plug in your data and start analyzing instantly! ⚡
👥 Who Can Benefit from This Dashboard
💆♀️ Salon & Spa Owners: Track profitability and resource utilization easily.
💄 Beauty Chain Managers: Compare performance across branches and departments.
🧴 Operations Teams: Monitor cancellation rates and improve efficiency.
💰 Finance & Marketing Teams: Align budgets and promotions with actual results.
⭐ Customer Experience Managers: Evaluate satisfaction and drive retention.
This dashboard is designed for anyone seeking clarity, control, and consistency in their beauty business performance.
🌈 Why Choose This Power BI Dashboard
✔️ Real-time visual insights for quick decision-making
✔️ Centralized data view — one file, multiple analytics layers
✔️ Fully customizable KPIs and visuals
✔️ Seamless integration with Excel & Power BI Service
✔️ Simplified performance reviews and team reporting
✔️ Ideal for small salons, franchises, or multi-branch enterprises
The Personal Care & Beauty Dashboard in Power BI is more than a reporting tool — it’s your command center for operational excellence, customer delight, and business growth. 🌸📈
### Click here to read the Detailed blog post
Visit our YouTube channel to learn step-by-step video tutorials


Reviews
There are no reviews yet.