

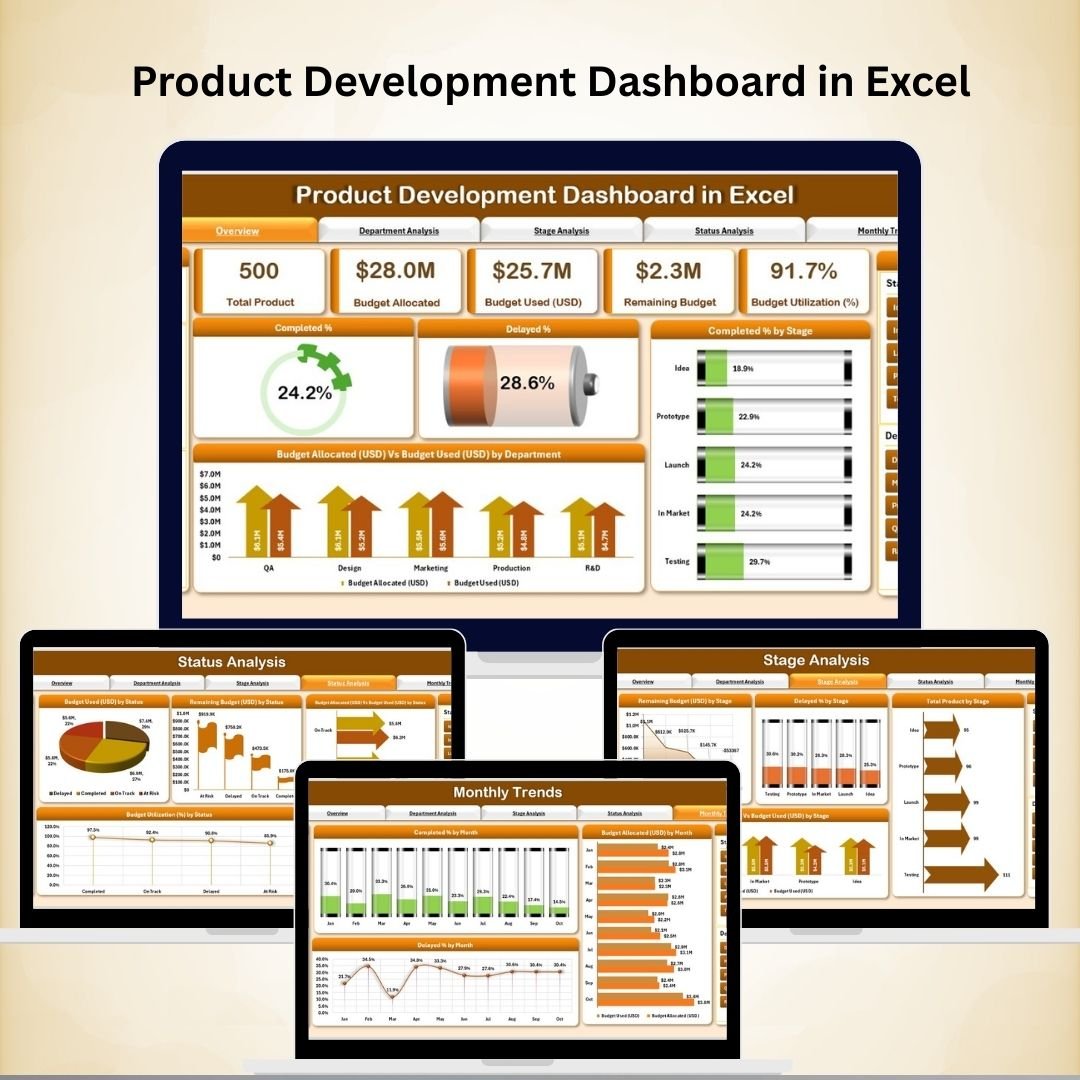

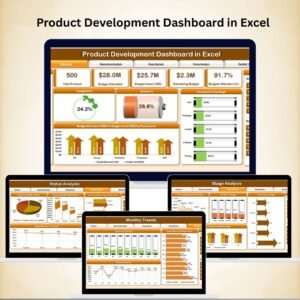
In today’s hyper-competitive business world, product development success depends on smart, data-driven decisions. From managing budgets to tracking timelines and monitoring departmental performance, businesses need a clear, structured way to visualize progress. That’s where the Product Development Dashboard in Excel comes in.
This powerful Excel-based solution transforms raw data into dynamic dashboards, interactive charts, and easy-to-read reports, giving managers a 360° view of ongoing product development. Instead of juggling multiple spreadsheets, leaders can now monitor budget usage, completion rates, delays, and departmental contributions — all in one place.
✨ Key Features of the Product Development Dashboard
🗂 Page Navigator – Seamless Navigation
A built-in side navigator lets you move between pages instantly.
No more endless scrolling or searching for tabs — just one click to get where you need.
📊 Five Interactive Analytical Pages
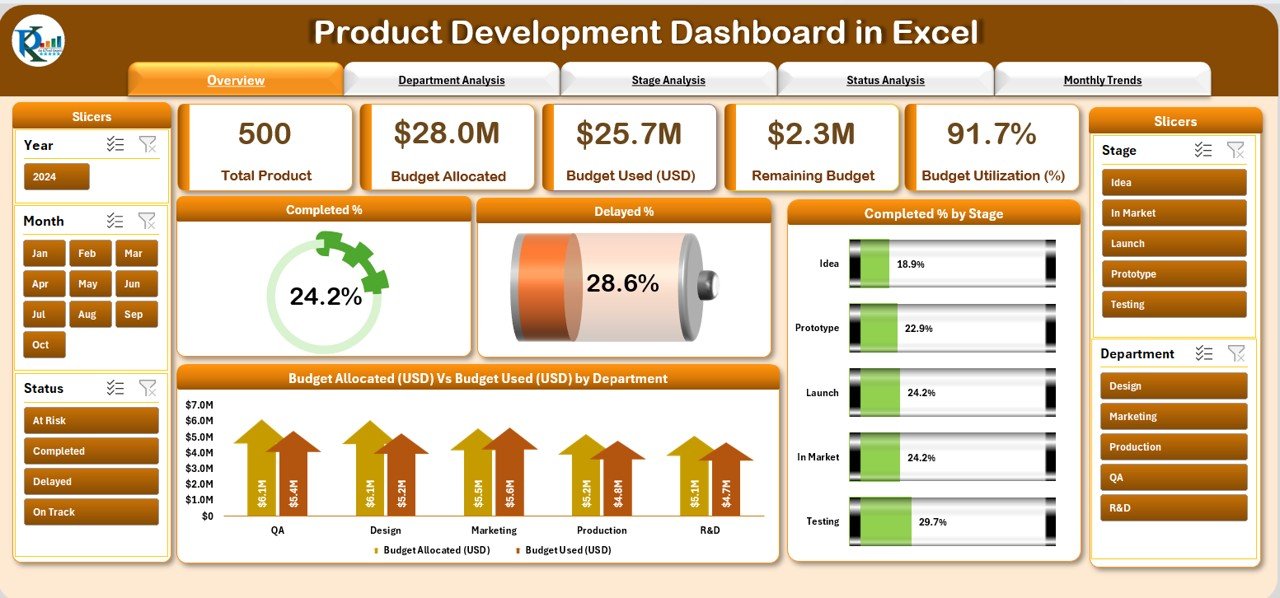
Overview Page – Centralized Summary
✅ Completion % of all projects
⏳ Delayed % (tasks running behind schedule)
📈 Completed % by Stage
💰 Budget Allocation vs Used (by Department)
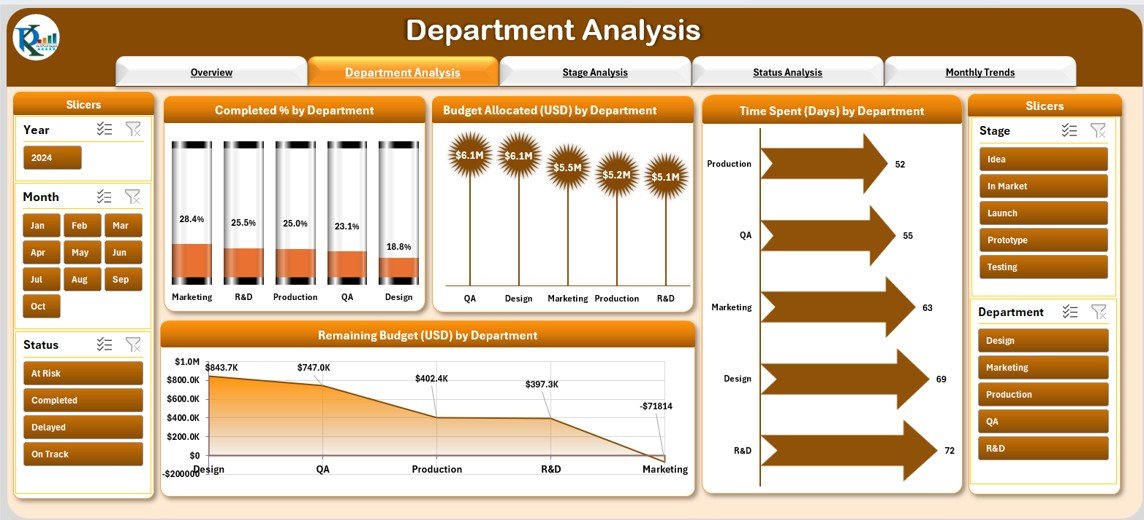
Department Analysis – Team-Level Insights
Completed % by Department
Budget Allocation vs Usage (USD)
Time Spent (Days) by Department
Remaining Budget (USD)
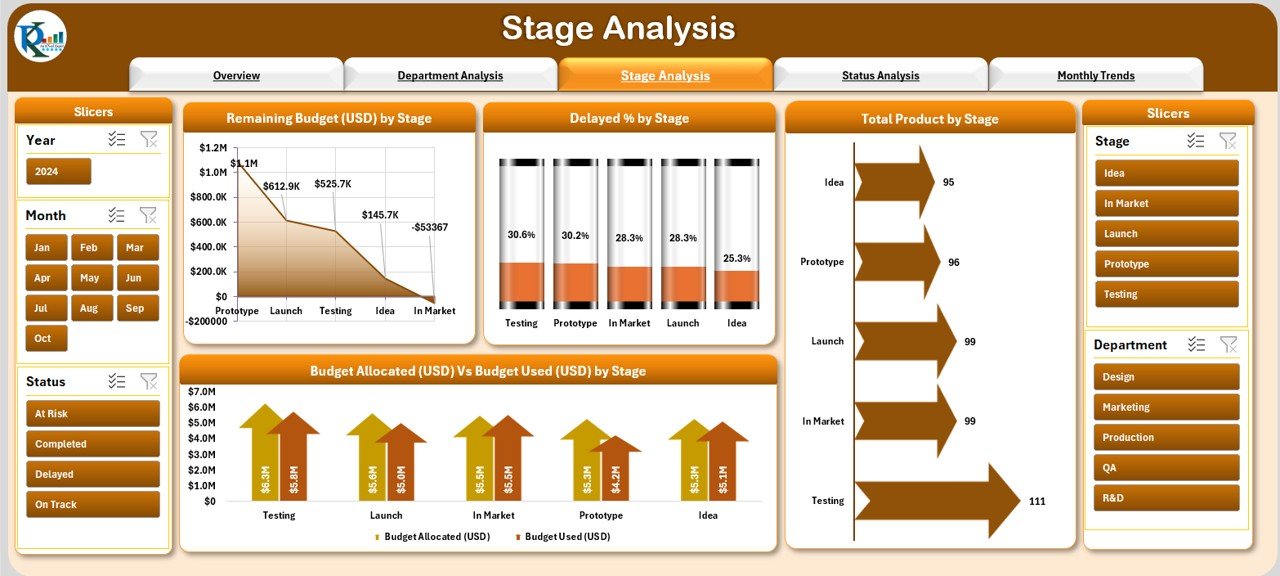
Stage Analysis – Process Performance
Remaining Budget by Stage
Delayed % by Stage
Total Products by Stage
Budget Allocation vs Usage (Stage-level)
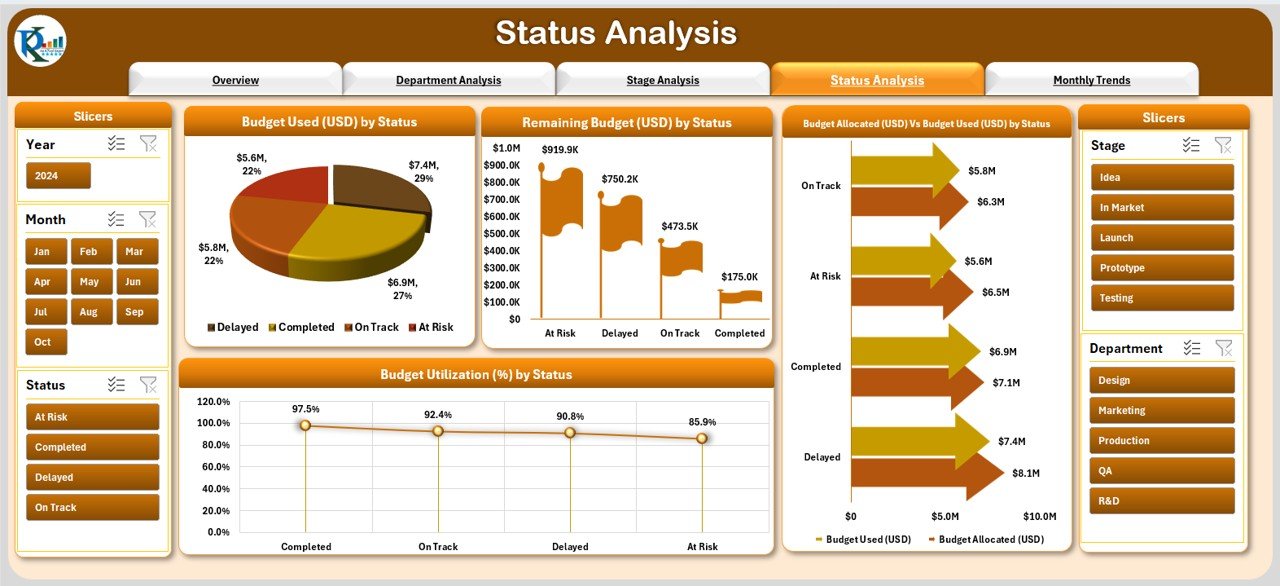
Status Analysis – Current Progress
Budget Used by Status
Remaining Budget by Status
Budget Allocation vs Usage
Budget Utilization %
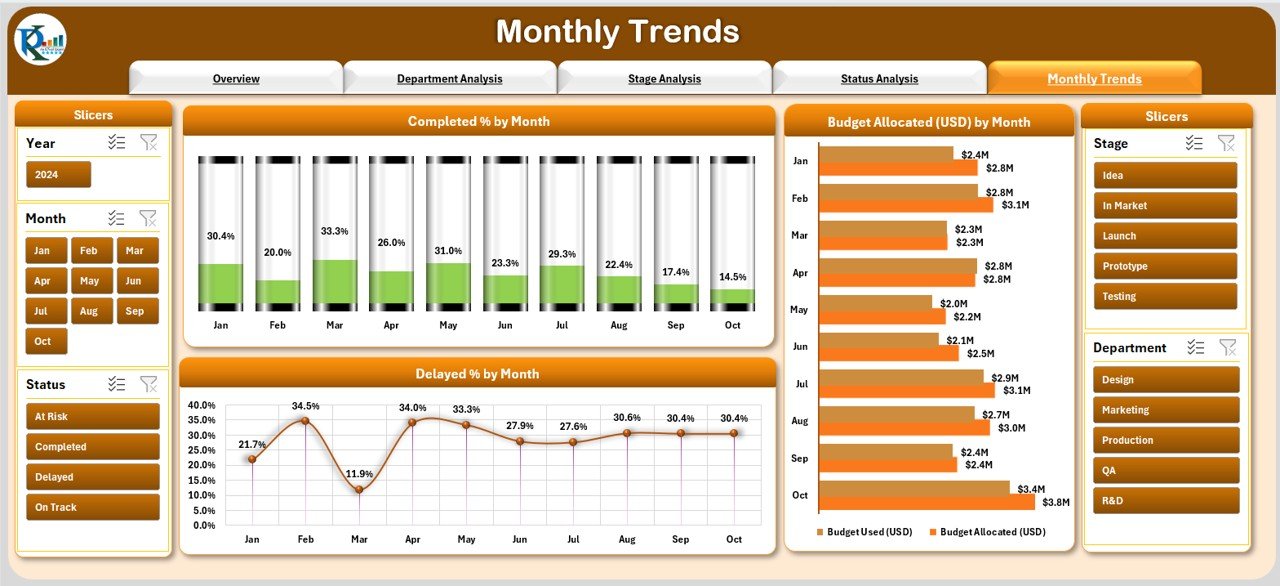
Monthly Trends – Time-Based Tracking
Completed % by Month
Budget Allocation vs Usage (Monthly)
Delayed % by Month
🛠 How to Use the Dashboard (Step-by-Step)
Step 1 – Define Your Metrics
List out KPIs such as Completion %, Budget Used, Delayed %, and Departmental Efficiency.
Step 2 – Enter Project Data
Fill in product details, stages, budgets, and timelines in the structured input sheets.
Step 3 – Refresh & Analyze
Update pivot tables with “Refresh All” and let Excel automatically update visuals.
Step 4 – Navigate Pages
Use the page navigator to switch between Overview, Department, Stage, Status, and Trends analysis.
Step 5 – Drill Down for Details
Filter data using slicers to isolate departments, stages, or timeframes for deeper insights.
🎯 Who Can Benefit from This Dashboard?
🏢 Product Managers – Monitor development timelines & budgets
👨💼 Executives – Get high-level project performance at a glance
🧑💻 R&D Teams – Identify bottlenecks & resource gaps
📊 Finance & Operations – Control budget allocation and cost utilization
🚀 Key Benefits
📌 Improved Transparency – Everyone sees the same numbers in one dashboard
💡 Better Budget Control – Track planned vs. used budgets instantly
⏳ Time Management – Detect delays early and take corrective action
👥 Department Accountability – Spot overperforming & underperforming teams
📊 Data-Driven Decisions – Replace guesswork with real-time metrics
🛠 100% Customizable – Add new KPIs or visuals as needed
💻 No Extra Software – Works entirely in Excel
💡 Best Practices for Using This Dashboard
Update data daily or weekly for accuracy
Keep KPIs clear and simple
Use conditional formatting to highlight risks
Train teams to interpret dashboard insights
Customize for your industry’s unique needs
🎓 Conclusion
The Product Development Dashboard in Excel is more than just a reporting template — it’s a strategic management tool that empowers businesses to deliver products on time, within budget, and with full visibility.
By consolidating multiple reports into one interactive Excel dashboard, managers can align teams, optimize resources, and improve decision-making. Whether you’re a startup or a large enterprise, this dashboard provides the clarity, control, and confidence you need to succeed.








Reviews
There are no reviews yet.