Efficient procurement is the backbone of a streamlined and cost-effective supply chain. If your business relies on multiple suppliers, departments, or procurement officers, tracking every detail—from orders to payments—can get overwhelming. That’s where the Procurement Analysis Dashboard in Excel steps in as your all-in-one command center.
Whether you’re monitoring costs, overdue payments, or supplier performance, this ready-to-use dashboard empowers procurement managers and business leaders with real-time insights, helping them stay ahead of issues, drive efficiency, and reduce operational costs—all in a familiar Excel environment.
🛠️ Key Features of Procurement Analysis Dashboard in Excel
This robust dashboard is built with advanced Excel functionalities, visuals, and formulas to help you manage procurement with precision and speed:
-
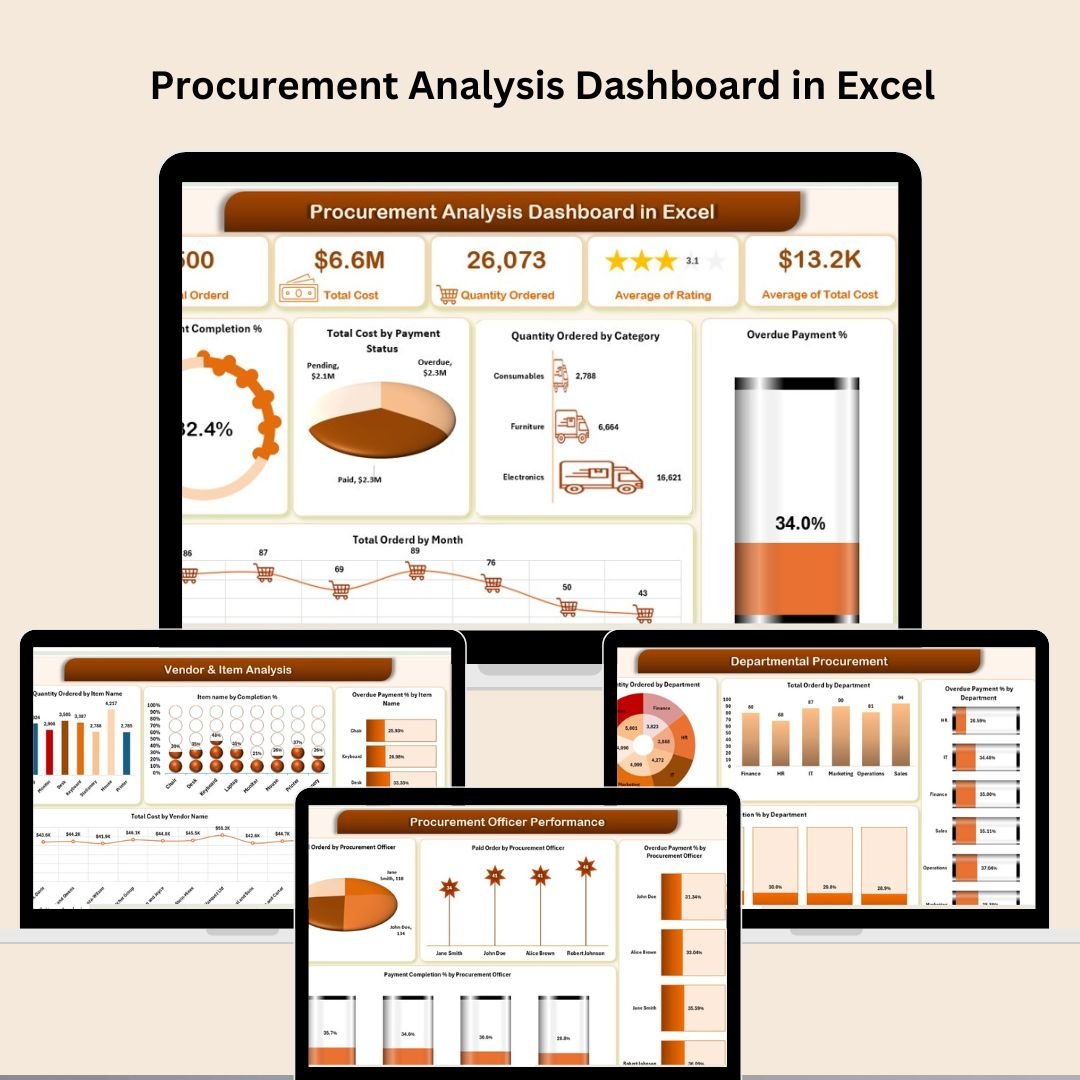
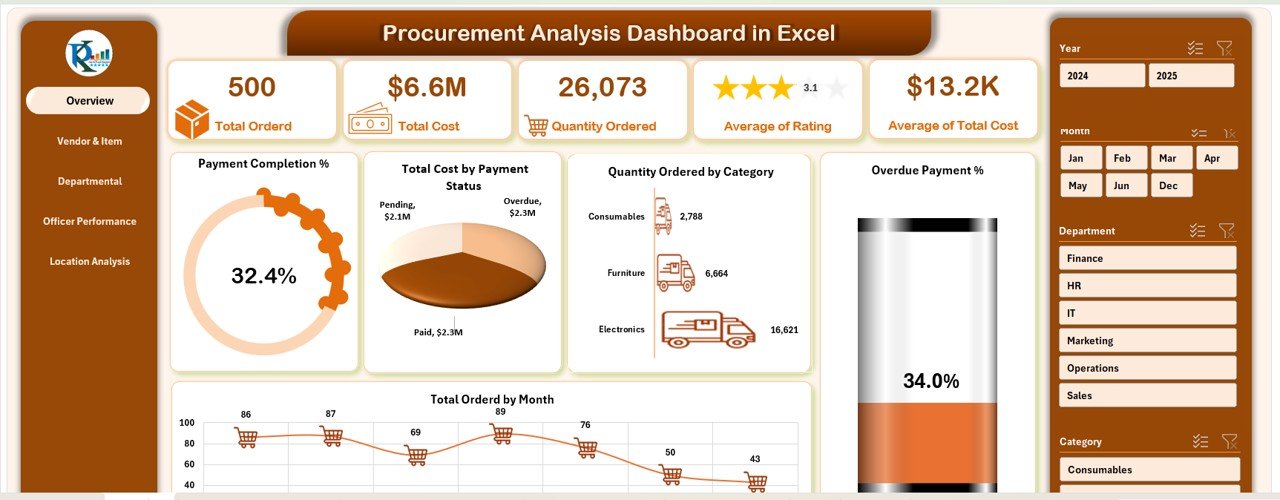
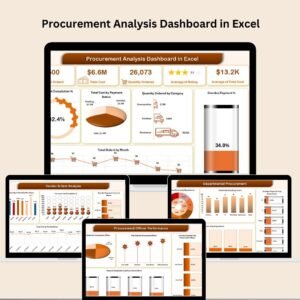
📋 Overview Page: Track total orders, average costs, quantity ordered, and payment status at a glance.
-
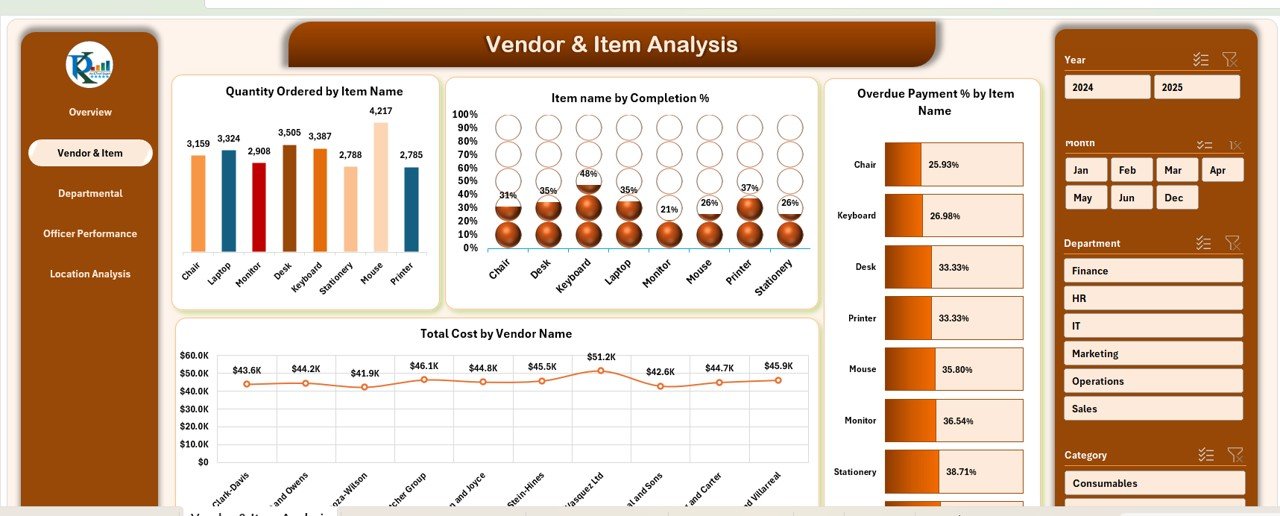
📦 Vendor & Item Analysis: Dive deep into item-wise ordering trends, vendor costs, and overdue statistics.
-
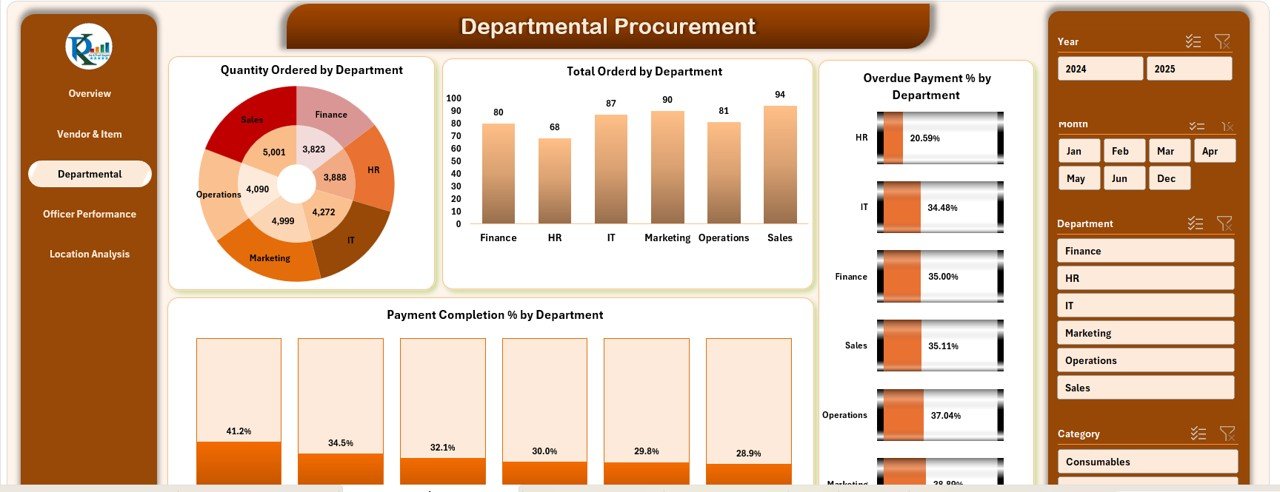
🏢 Departmental Summary: Understand how each department contributes to procurement volume and cost.
-
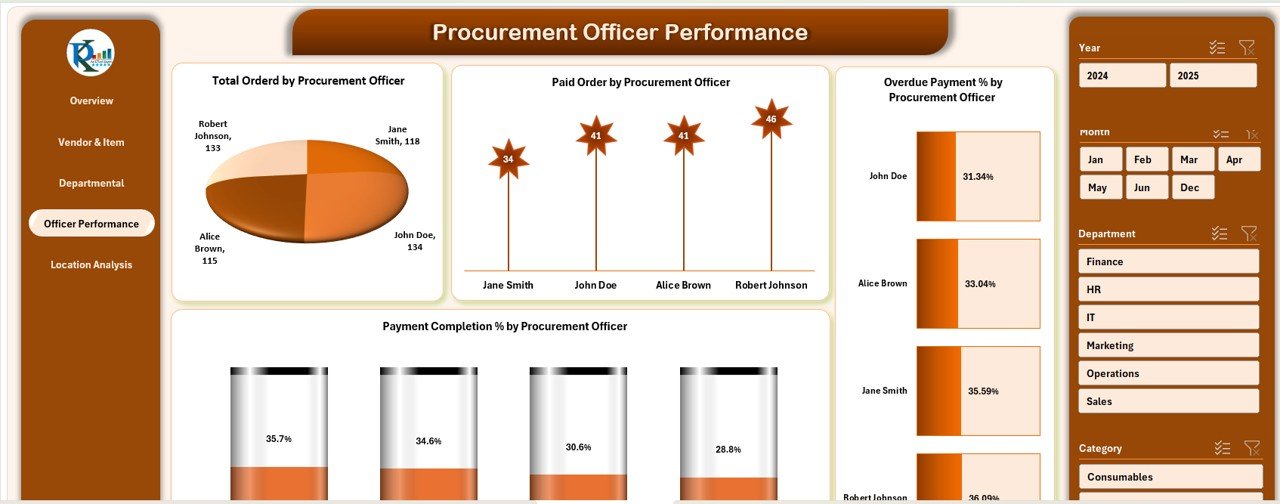
👩💼 Officer Performance: See how procurement officers are performing in terms of payment and order handling.
-
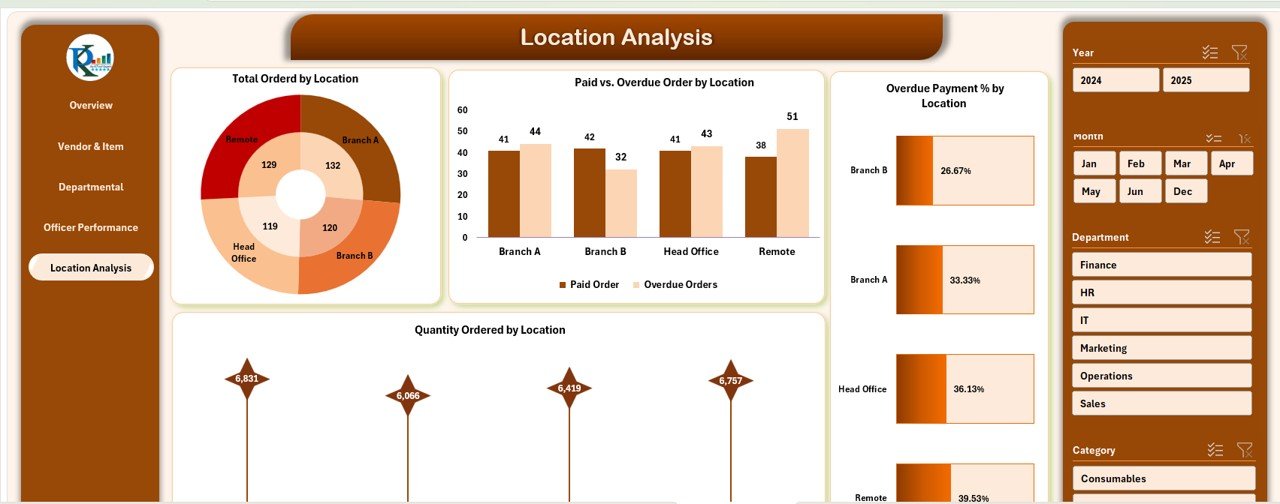
🌍 Location-Based Analysis: Visualize procurement efficiency across different business locations.
-
📥 Easy Data Input Sheet: Just fill in your procurement records and see the entire dashboard auto-refresh!
📂 What’s Inside the Procurement Dashboard?
You’ll get an Excel workbook with 6 fully functional worksheet tabs:
-
Dashboard (Overview) – KPI cards, summary charts, and trend indicators
-
Vendor & Item Analysis – Track vendor-specific costs and item-wise procurement
-
Departmental Procurement – Analyze procurement distribution across internal departments
-
Officer Performance – Monitor the performance of procurement team members
-
Location Analysis – Region/location-wise procurement monitoring
-
Data Sheet – Structured table to input procurement records
All sections are visually rich with PivotCharts and conditional formatting (📈 up/down arrows), offering instant clarity!
🧑💻 How to Use the Procurement Dashboard
-
Input Procurement Data → Use the “Data Sheet” tab to enter order details, cost, vendor, department, officer, and status.
-
View Real-Time Insights → Instantly see all data visualized across various tabs and charts.
-
Monitor Trends and Payments → Check overdue payments, track order volume, and evaluate vendor performance.
-
Customize if Needed → Easily add new KPIs, categories, or modify existing layouts.
No coding. No macros. Just plug, play, and analyze! 🔍
👥 Who Can Benefit from This Dashboard?
This dashboard is a game-changer for:
-
✅ Procurement Managers
-
✅ Supply Chain Analysts
-
✅ Operations & Admin Teams
-
✅ Finance Controllers
-
✅ Small and Medium Enterprises (SMEs)
-
✅ Large Corporates with multi-location procurement
Whether you’re managing procurement for 1 branch or 50 locations—this tool gives you full visibility and control over your spending and vendor performance. 🚀


Reviews
There are no reviews yet.