Running a photography business is more than just capturing great moments—it requires careful monitoring of performance metrics to ensure profitability and client satisfaction. From tracking session bookings and revenue to evaluating client feedback and project delivery timelines, every detail counts.
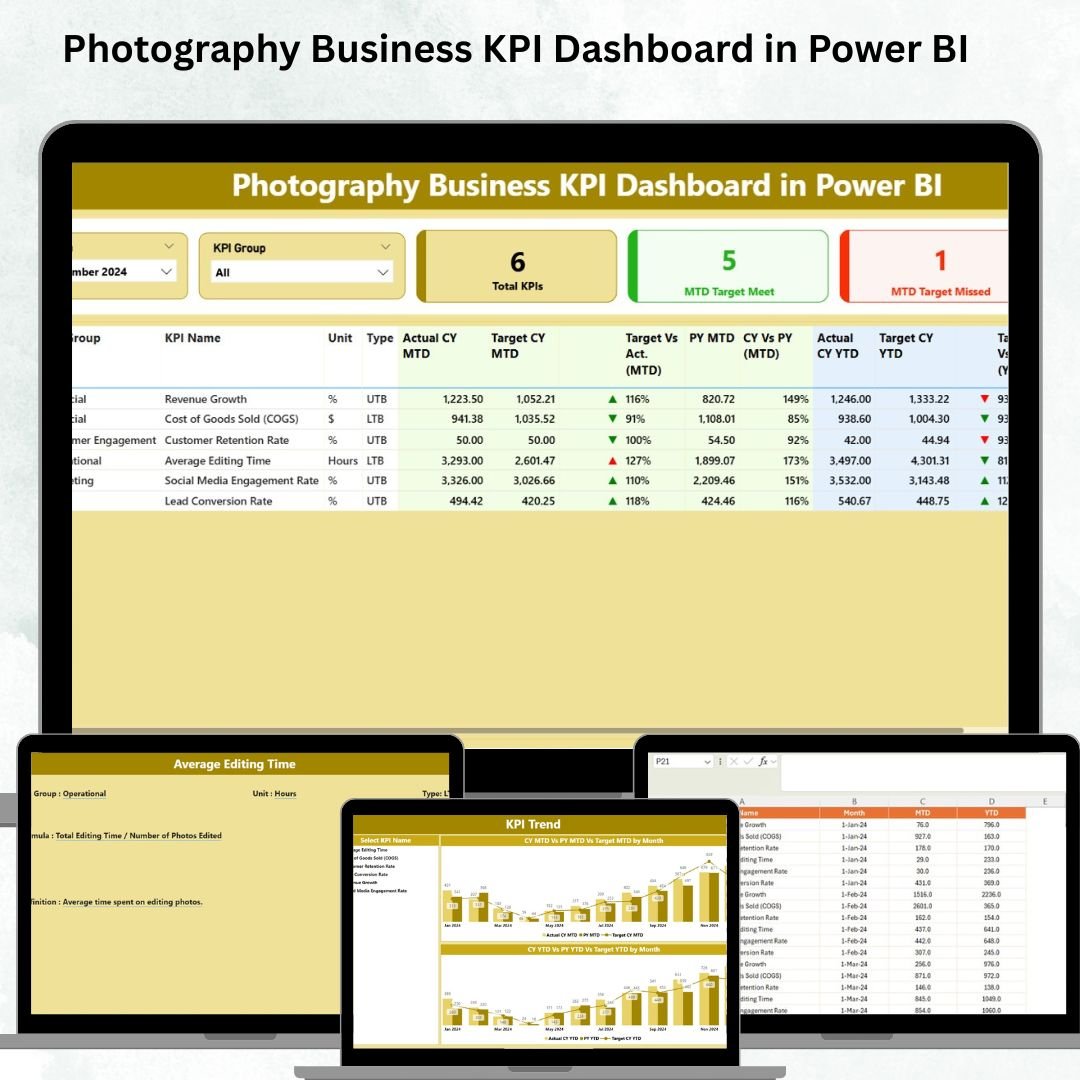
The Photography Business KPI Dashboard in Power BI is a ready-to-use reporting solution designed specifically for photography studios and freelance professionals. By consolidating critical KPIs into an interactive and easy-to-navigate dashboard, this tool helps you track performance, measure progress against targets, and identify growth opportunities in real time.
With built-in MTD (Month-to-Date), YTD (Year-to-Date), and year-over-year comparisons, this dashboard offers complete visibility into your photography business operations. 📸
🔑 Key Features of the Photography Business KPI Dashboard
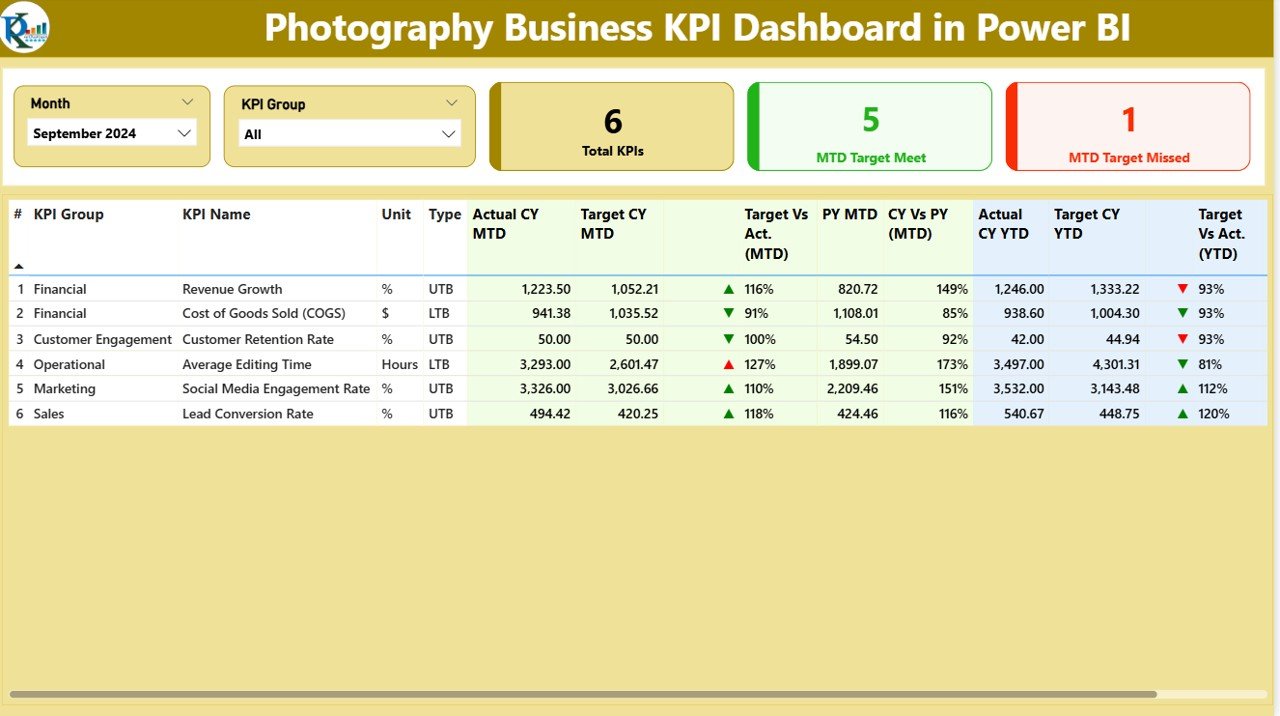
📋 Summary Page
-
Cards: Displays KPI counts, MTD target met/missed counts, and YTD performance.
-
Detailed KPI Table:
-
KPI Number, Group, and Name
-
Unit of Measurement (e.g., $, %, count)
-
Type (Lower-the-Better or Upper-the-Better)
-
Actual vs Target (MTD & YTD)
-
Red/Green arrows for quick status visibility
-
Comparison with previous year (MTD & YTD)
-
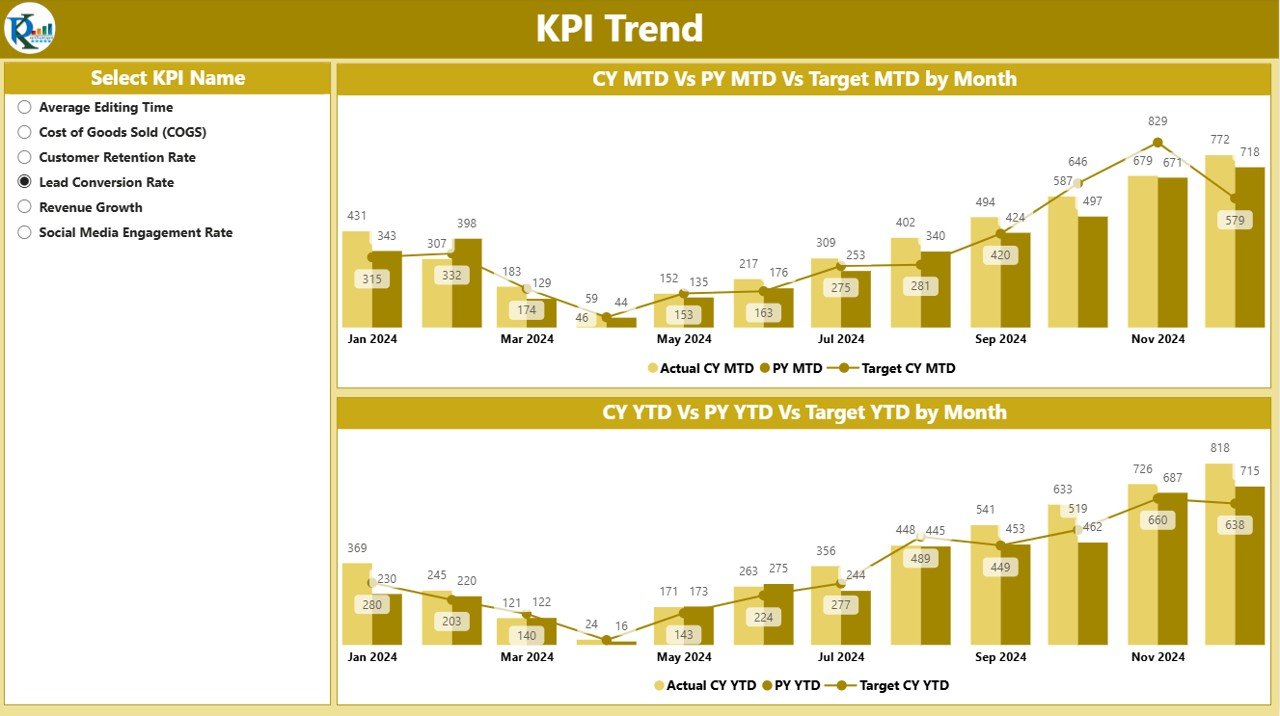
📈 KPI Trend Page
-
Combo charts show:
-
Actual vs Target values
-
Previous year data for comparison
-
-
Slicer option to focus on a specific KPI
-
Month-to-month and year-over-year trend analysis
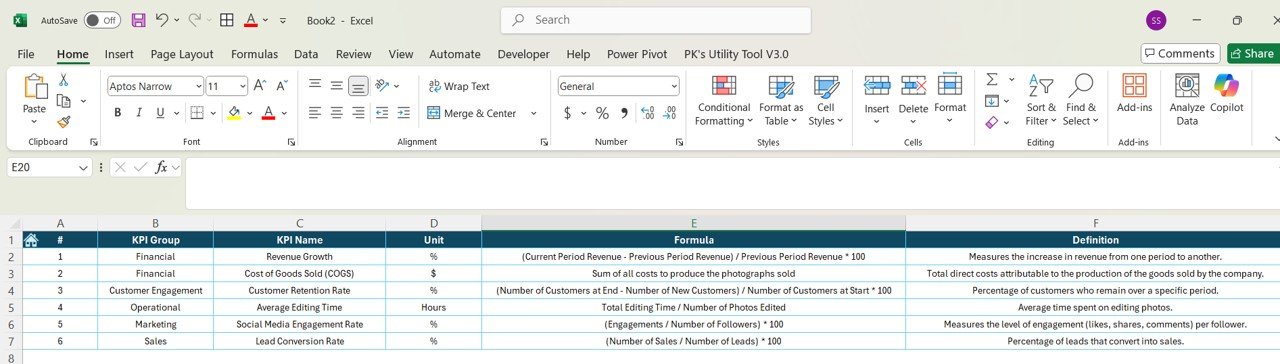
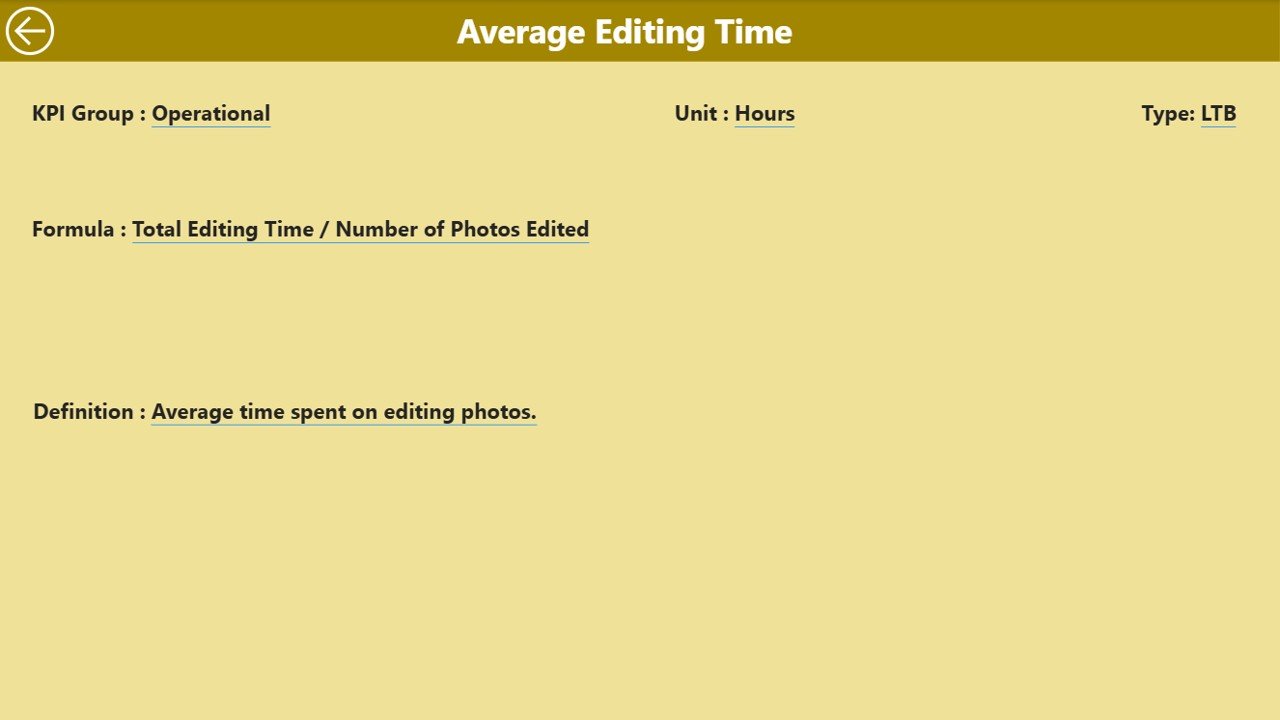
📖 KPI Definition Page
-
Drill-through, hidden view with:
-
KPI formulas, units, type, and definitions
-
-
Ensures team-wide clarity on performance metrics
-
Eliminates confusion and enhances reporting transparency
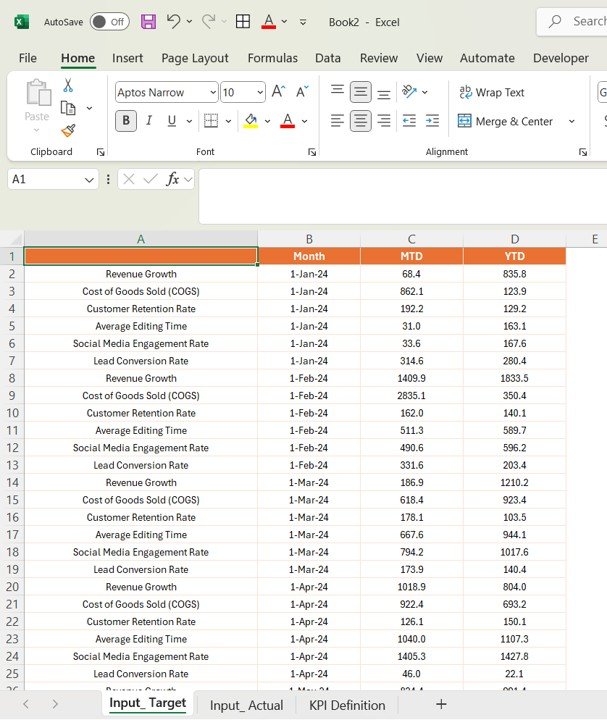
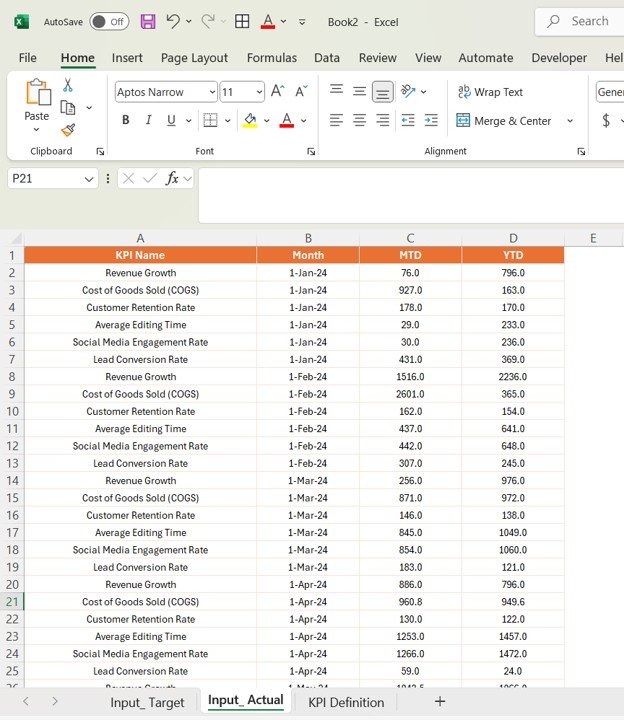
🗂️ Excel Data Inputs
-
Input_Actual: Record actual performance data (MTD/YTD).
-
Input_Target: Enter KPI targets for accurate tracking.
-
KPI Definition: Maintain KPI metadata (Name, Formula, Group, Type, Unit).
-
Automatic sync with Power BI visuals for real-time insights.
📦 What’s Inside the Dashboard?
✅ Pre-Built Power BI File (.pbix) – Fully interactive & customizable
✅ 3 Pages – Summary, KPI Trend, and KPI Definition
✅ Excel Data Source – For inputting actuals, targets, and KPI details
✅ Conditional Formatting & Icons – Quick performance evaluation
✅ Scalable KPIs – Add new metrics as your business grows
✅ Professional Layout – Client-ready and boardroom-ready reporting
👥 Who Can Benefit from This Dashboard?
🎯 Photography Studio Owners – Track bookings, projects, and revenue performance
🎯 Freelance Photographers – Monitor client satisfaction and personal growth metrics
🎯 Studio Managers – Compare MTD vs YTD performance and manage operations
🎯 Business Consultants – Provide insights into photography business KPIs
🎯 Small & Medium Businesses – Scale operations with structured performance analytics
🌟 Advantages of Using the Photography Business KPI Dashboard
-
✅ Real-Time Monitoring – Instant KPI tracking with interactive Power BI visuals
-
✅ Data-Driven Decision Making – Identify underperforming areas and optimize operations
-
✅ MTD & YTD Tracking – Evaluate monthly and cumulative yearly performance
-
✅ Year-over-Year Comparison – Spot long-term trends and growth opportunities
-
✅ Customizable KPIs – Easily adapt to specific business needs like social media reach or client reviews
-
✅ Professional Reporting – Create client-facing and management-ready reports in seconds
🧪 Best Practices for Using the Dashboard
-
Update Excel Inputs Monthly – Keep actuals and targets fresh for accurate tracking
-
Review MTD vs YTD Metrics – Spot performance gaps early
-
Use Trend Page Regularly – Identify seasonal booking and revenue patterns
-
Customize KPIs – Add unique studio metrics like referral leads or editing turnaround times
-
Leverage Previous Year Comparisons – Understand historical performance to make smarter forecasts
🎯 How This Dashboard Helps Photography Businesses
-
Improve revenue tracking and spot financial gaps
-
Enhance client satisfaction monitoring through timely reporting
-
Streamline studio operations with consolidated data views
-
Increase productivity and efficiency by focusing on high-impact KPIs
-
Make strategic business decisions using reliable insights


Reviews
There are no reviews yet.